 1.) Between 1921 and 1950, the number of Hungarians decreased. After the First World War, the decline can be explained by the relocation of some of the Hungarian middle classes to Hungary, often only by a statistical change of nationality of those with multiple nationalities, and by the “statistical separation” of a part of the Jewish population from the Hungarian population. During the Second World War and in the following years, contradictory processes took place: in the areas reannexed to Hungary, some of the mixed-heritage population reasserted their Hungarian identity, but the number of Hungarians was reduced by the Jews deported to extermination camps. The number of Hungarians decreased the most in the second half of the 1940s due to deportations, population changes, and reslovakization. It is not a coincidence that in the 1950 census, the number of Hungarians was 237,805 lower than it had been in 1930.
2.) Between 1950 and 1991, the number of Hungarians increased in each decade at a decreasing rate. The exceptionally high increase in the 1950s can be traced in part to high natural reproduction, and to a much greater extent to the Hungarian commitment of the previously reslovakized Hungarians. In the 1960s, the significant natural increase was supplemented by the “statistical return” of some of those who had assumed Hungarian identity. In the 1970s and 1980s the assimilation and change of nationality processes significantly reduced the natural reproduction rate, which had already declined but was still significant. At the same time, in the period between the change of regime and the 1991 census, a part of those who had previously identified themselves as Slovaks—with a diverse territorial and age composition—identified themselves as Hungarians. On the other hand, the 1991 census extended the list of nationalities, including the category of Roma. A not insignificant proportion of those who declared themselves as Roma had declared themselves as Hungarian in previous censuses.
3.) The third phase in the demographic history of the Hungarian population in Slovakia is the period from the 1990s to the present, which is characterized by a significant decline in the number of Hungarians.
Between 1991 and 2001, the number of Hungarians decreased by 47,000, between 2001 and 2011 by 62,000, and between 2011 and 2021 by 36,000.
However, during the last three censuses, we had to deal with a previously non-existent problem regarding the change of the number of nationalities. While at the time of the 1980 and earlier censuses, the proportion of unknowns (i.e., those who did not declare their ethnicity) was statistically negligible, in 1991 there were 8,782 people, in 2001 54,502 people (i.e., 1% of the population), and in 2011 382, 493 (i.e., 7% of the population) who did not declare their nationality. In 2021, the number of non-respondents to the question on nationality decreased to 295,558, and their share in the total population fell to 5.4%.
The (Czecho)Slovak censuses asked not only about nationality but also on five occasions (1970, 1991, 2001, 2011, and 2021) about mother tongue. According to the mother tongue, the number of the Hungarian population was 600,249 in 1970. The highest number was recorded in 1991 (608,221), and in the following years their number decreased almost in parallel with the nationality data. In 2021, 462,175 Hungarian native speakers were counted. The proportion of native Hungarian speakers in the total population is not significantly higher than that of Hungarians. In 1970, 13.2% of the population, in 1991 11.5%, in 2021 8.5% were native Hungarian speakers. (Figure 2, Table F2.)
The size of the difference between these two indicators of nationality can be explained by a variety of factors, including shifts in the proportion of mixed marriages and changes in the political situation of minorities.
There is a specific correlation between nationality and mother tongue data for each nationality: the number of members of the majority nation is higher according to nationality, and the number of national minorities, including Hungarians, is higher according to mother tongue. One could also say that nationality is a kind of “official data,” given the fact that different forms include a question on nationality, while the mother tongue category does not. The ratio of the two data points (and the difference between the two) indicates the consistency of the nationality. The smaller the difference between these two indicators, the more solid the national affiliation of members of each nationality is perceived to be. The number of Hungarians based on mother tongue data was 8.7% higher in 1970 and 9.5% higher in 2021 than the number based on ethnicity. The two data points differed the least in 1991 (i.e., by 7.2%). It is assumed that a kind of positive vision of the future, which strengthened in the short period after the regime change, may have contributed to the catching-up of the number of ethnic Hungarians with the number of native Hungarian speakers. In 2001, 1.2% of the population did not respond to the question on mother tongue affiliation, in 2011 7.5%, and in 2021 5.4%.
Diagram 2: The number of Hungarians according to nationality and mother tongue, 1970–2021
1.) Between 1921 and 1950, the number of Hungarians decreased. After the First World War, the decline can be explained by the relocation of some of the Hungarian middle classes to Hungary, often only by a statistical change of nationality of those with multiple nationalities, and by the “statistical separation” of a part of the Jewish population from the Hungarian population. During the Second World War and in the following years, contradictory processes took place: in the areas reannexed to Hungary, some of the mixed-heritage population reasserted their Hungarian identity, but the number of Hungarians was reduced by the Jews deported to extermination camps. The number of Hungarians decreased the most in the second half of the 1940s due to deportations, population changes, and reslovakization. It is not a coincidence that in the 1950 census, the number of Hungarians was 237,805 lower than it had been in 1930.
2.) Between 1950 and 1991, the number of Hungarians increased in each decade at a decreasing rate. The exceptionally high increase in the 1950s can be traced in part to high natural reproduction, and to a much greater extent to the Hungarian commitment of the previously reslovakized Hungarians. In the 1960s, the significant natural increase was supplemented by the “statistical return” of some of those who had assumed Hungarian identity. In the 1970s and 1980s the assimilation and change of nationality processes significantly reduced the natural reproduction rate, which had already declined but was still significant. At the same time, in the period between the change of regime and the 1991 census, a part of those who had previously identified themselves as Slovaks—with a diverse territorial and age composition—identified themselves as Hungarians. On the other hand, the 1991 census extended the list of nationalities, including the category of Roma. A not insignificant proportion of those who declared themselves as Roma had declared themselves as Hungarian in previous censuses.
3.) The third phase in the demographic history of the Hungarian population in Slovakia is the period from the 1990s to the present, which is characterized by a significant decline in the number of Hungarians.
Between 1991 and 2001, the number of Hungarians decreased by 47,000, between 2001 and 2011 by 62,000, and between 2011 and 2021 by 36,000.
However, during the last three censuses, we had to deal with a previously non-existent problem regarding the change of the number of nationalities. While at the time of the 1980 and earlier censuses, the proportion of unknowns (i.e., those who did not declare their ethnicity) was statistically negligible, in 1991 there were 8,782 people, in 2001 54,502 people (i.e., 1% of the population), and in 2011 382, 493 (i.e., 7% of the population) who did not declare their nationality. In 2021, the number of non-respondents to the question on nationality decreased to 295,558, and their share in the total population fell to 5.4%.
The (Czecho)Slovak censuses asked not only about nationality but also on five occasions (1970, 1991, 2001, 2011, and 2021) about mother tongue. According to the mother tongue, the number of the Hungarian population was 600,249 in 1970. The highest number was recorded in 1991 (608,221), and in the following years their number decreased almost in parallel with the nationality data. In 2021, 462,175 Hungarian native speakers were counted. The proportion of native Hungarian speakers in the total population is not significantly higher than that of Hungarians. In 1970, 13.2% of the population, in 1991 11.5%, in 2021 8.5% were native Hungarian speakers. (Figure 2, Table F2.)
The size of the difference between these two indicators of nationality can be explained by a variety of factors, including shifts in the proportion of mixed marriages and changes in the political situation of minorities.
There is a specific correlation between nationality and mother tongue data for each nationality: the number of members of the majority nation is higher according to nationality, and the number of national minorities, including Hungarians, is higher according to mother tongue. One could also say that nationality is a kind of “official data,” given the fact that different forms include a question on nationality, while the mother tongue category does not. The ratio of the two data points (and the difference between the two) indicates the consistency of the nationality. The smaller the difference between these two indicators, the more solid the national affiliation of members of each nationality is perceived to be. The number of Hungarians based on mother tongue data was 8.7% higher in 1970 and 9.5% higher in 2021 than the number based on ethnicity. The two data points differed the least in 1991 (i.e., by 7.2%). It is assumed that a kind of positive vision of the future, which strengthened in the short period after the regime change, may have contributed to the catching-up of the number of ethnic Hungarians with the number of native Hungarian speakers. In 2001, 1.2% of the population did not respond to the question on mother tongue affiliation, in 2011 7.5%, and in 2021 5.4%.
Diagram 2: The number of Hungarians according to nationality and mother tongue, 1970–2021
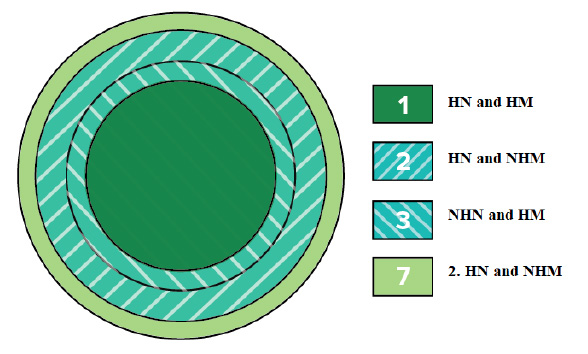
 Of the four types, the least problematic is to consider those who declared themselves Hungarian according to their nationality and mother tongue (HN = Hungarian Nationality; HM = Hungarian Mother Tongue) as belonging to the Hungarian national community. Similarly, at least on an analytical level, we do not consider those who did not assume either Hungarian nationality or Hungarian mother tongue according to either of these two indicators as Hungarian (NHN = Non-Hungarian Nationality; NHM = Non-Hungarian Mother Tongue). However, the number of those who are Hungarian only according to one of the identification indicators is not negligible. For the Hungarians in Slovakia, the number of non-Hungarian nationality and of Hungarian tongue (NHN and HM) is a fraction of about one-third to one-fifth of the number of those who declared themselves as belonging to Hungarian nationality and non-Hungarian mother tongue speakers (HN and NHM). Our data on the combination of the two variables are only available for the last three censuses.
Diagram 3: Types of belonging to Hungarians according to nationality and mother tongue, 2001–2021
Of the four types, the least problematic is to consider those who declared themselves Hungarian according to their nationality and mother tongue (HN = Hungarian Nationality; HM = Hungarian Mother Tongue) as belonging to the Hungarian national community. Similarly, at least on an analytical level, we do not consider those who did not assume either Hungarian nationality or Hungarian mother tongue according to either of these two indicators as Hungarian (NHN = Non-Hungarian Nationality; NHM = Non-Hungarian Mother Tongue). However, the number of those who are Hungarian only according to one of the identification indicators is not negligible. For the Hungarians in Slovakia, the number of non-Hungarian nationality and of Hungarian tongue (NHN and HM) is a fraction of about one-third to one-fifth of the number of those who declared themselves as belonging to Hungarian nationality and non-Hungarian mother tongue speakers (HN and NHM). Our data on the combination of the two variables are only available for the last three censuses.
Diagram 3: Types of belonging to Hungarians according to nationality and mother tongue, 2001–2021
 If we then try to draw a more nuanced picture of the ethnic composition of Hungarians in Slovakia, we would have to say that a kind of core group of Hungarians in Slovakia are those who declared themselves Hungarian in terms of both indicators (507,220 people in 2001, 443,632 people in 2011, and 403,140 people in 2021). However, the Hungarian population in Slovakia also includes, to a greater or lesser extent, a significant number of other persons (79, 017 in 2001, 79,917 in 2011, and 77,960 in 2021) who declared themselves Hungarian according to only one of the indicators in the last three censuses. Thus, the census-data-based number of persons with a smaller to larger Hungarian community affiliation—a kind of „ethnic potential”—was 586,237 [this number seems to be inaccurate] in 2001, 52,349 in 2011, and 48,111 in 2021 (see Table F3).
The separation and delimitation of these two additional smaller groups would require further elaboration. It seems a simpler task to delimit group 3 according to Table 1, those with non-Hungarian (Slovak) nationality and Hungarian mother tounge. Based on an ethnicity study carried out in 2000, it is known that about one-fifth of those from mixed Hungarian–Slovak marriages were Hungarian by ethnicity and fourfifths were Slovak, while the ratio was around 1:2 by mother tongue. Similarly, 73% of those of Hungarian origin who had received education in a non-Hungarian language declared themselves to be of Hungarian nationality, but 83% claimed to be Hungarian mother tongue speakers. By other indicators of dual affiliation (language skills, cultural consumption, etc.), more people belonged to the Hungarian community than to the
Hungarian nationality. (Data from a survey carried out in 2000; see Gyurgyík 2004.) The other type of the study on mother tongue/nationality dichotomy, the group of Hungarian nationality and Slovak mother tongue speakers, is perhaps a more difficult group to define. It is probable that in terms of belonging to the Hungarian national community, they are located between the “core group” (Hungarian nationality and Hungarian mother tongue) and the external sphere (Slovak nationality and Hungarian mother tongue). Some of them are of mixed origin, who are of Hungarian nationality but not native Hungarian speakers, in other words those of homogeneous Hungarian origin who were socialized in a more Slovak language environment but have retained their national affiliation according to their origin. Further, the number of those belonging to this group was increased by those of Roma origin who (in addition to their Hungarian nationality) indicated Roma as their mother tongue.
If we examine the development of the three types of belonging to the Hungarians in the three censuses, it is observable that the proportion of those belonging to the core group who were Hungarian according to at least one indicator decreased by a not insignificant amount, from 86.5% to 83.8%. On the other hand, the proportion of the two groups of Hungarians according to only one indicator increased. The group of those of Hungarian nationality and Slovak mother tongue shows a more intensive growth (from 2.3% to 3.9%) than the group of those of Slovak nationality and Hungarian mother tongue (from 11.2% to 12.3%).
If we then try to draw a more nuanced picture of the ethnic composition of Hungarians in Slovakia, we would have to say that a kind of core group of Hungarians in Slovakia are those who declared themselves Hungarian in terms of both indicators (507,220 people in 2001, 443,632 people in 2011, and 403,140 people in 2021). However, the Hungarian population in Slovakia also includes, to a greater or lesser extent, a significant number of other persons (79, 017 in 2001, 79,917 in 2011, and 77,960 in 2021) who declared themselves Hungarian according to only one of the indicators in the last three censuses. Thus, the census-data-based number of persons with a smaller to larger Hungarian community affiliation—a kind of „ethnic potential”—was 586,237 [this number seems to be inaccurate] in 2001, 52,349 in 2011, and 48,111 in 2021 (see Table F3).
The separation and delimitation of these two additional smaller groups would require further elaboration. It seems a simpler task to delimit group 3 according to Table 1, those with non-Hungarian (Slovak) nationality and Hungarian mother tounge. Based on an ethnicity study carried out in 2000, it is known that about one-fifth of those from mixed Hungarian–Slovak marriages were Hungarian by ethnicity and fourfifths were Slovak, while the ratio was around 1:2 by mother tongue. Similarly, 73% of those of Hungarian origin who had received education in a non-Hungarian language declared themselves to be of Hungarian nationality, but 83% claimed to be Hungarian mother tongue speakers. By other indicators of dual affiliation (language skills, cultural consumption, etc.), more people belonged to the Hungarian community than to the
Hungarian nationality. (Data from a survey carried out in 2000; see Gyurgyík 2004.) The other type of the study on mother tongue/nationality dichotomy, the group of Hungarian nationality and Slovak mother tongue speakers, is perhaps a more difficult group to define. It is probable that in terms of belonging to the Hungarian national community, they are located between the “core group” (Hungarian nationality and Hungarian mother tongue) and the external sphere (Slovak nationality and Hungarian mother tongue). Some of them are of mixed origin, who are of Hungarian nationality but not native Hungarian speakers, in other words those of homogeneous Hungarian origin who were socialized in a more Slovak language environment but have retained their national affiliation according to their origin. Further, the number of those belonging to this group was increased by those of Roma origin who (in addition to their Hungarian nationality) indicated Roma as their mother tongue.
If we examine the development of the three types of belonging to the Hungarians in the three censuses, it is observable that the proportion of those belonging to the core group who were Hungarian according to at least one indicator decreased by a not insignificant amount, from 86.5% to 83.8%. On the other hand, the proportion of the two groups of Hungarians according to only one indicator increased. The group of those of Hungarian nationality and Slovak mother tongue shows a more intensive growth (from 2.3% to 3.9%) than the group of those of Slovak nationality and Hungarian mother tongue (from 11.2% to 12.3%).
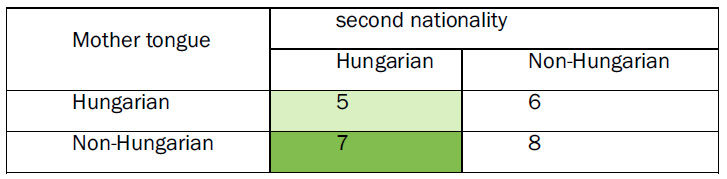
 In order to examine the interrelations and interactions of the three variables indicating ethnic attachment, we need to consider the interrelations of ethnicity and mother tongue in addition to the interrelations shown in Table 1. As can be seen from Table 2, from the point of view of Hungarians, two combinations have a meaningful Hungarian connotation in relation to the second nationality: the combination of the Hungarian second nationality and Hungarian mother tongue (5), and of the Hungarian second nationality and non-Hungarian mother tongue (7). Those belonging to the combination of Hungarian nationality and Hungarian mother tongue (5) are already included in the combination of non-Hungarian nationality and Hungarian mother tongue (3) described in Table 1 (3). (Combinations 6 and 8 have no Hungarian relevance.)
Table 2. Types of the distribution by second nationality and mother tongue
In order to examine the interrelations and interactions of the three variables indicating ethnic attachment, we need to consider the interrelations of ethnicity and mother tongue in addition to the interrelations shown in Table 1. As can be seen from Table 2, from the point of view of Hungarians, two combinations have a meaningful Hungarian connotation in relation to the second nationality: the combination of the Hungarian second nationality and Hungarian mother tongue (5), and of the Hungarian second nationality and non-Hungarian mother tongue (7). Those belonging to the combination of Hungarian nationality and Hungarian mother tongue (5) are already included in the combination of non-Hungarian nationality and Hungarian mother tongue (3) described in Table 1 (3). (Combinations 6 and 8 have no Hungarian relevance.)
Table 2. Types of the distribution by second nationality and mother tongue
 The correlations of the three variables of ethnicity with respect to affiliation to Hungarian community are illustrated in Diagram 5.
Diagram 5: The distribution of Hungarians in Slovakia according to their types, 2021
The correlations of the three variables of ethnicity with respect to affiliation to Hungarian community are illustrated in Diagram 5.
Diagram 5: The distribution of Hungarians in Slovakia according to their types, 2021
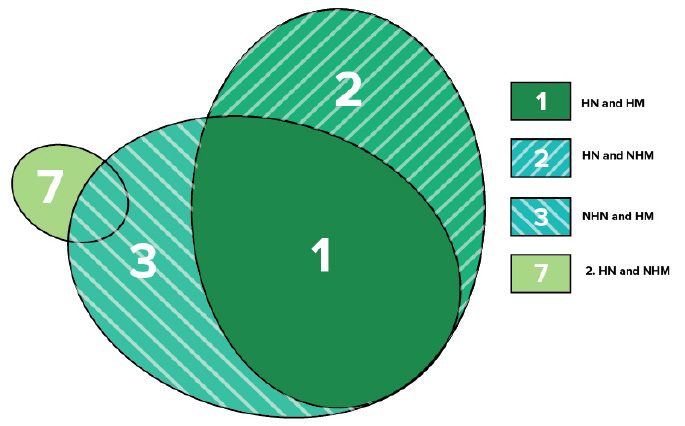 Diagram 5 shows that a part of those belonging to nationality 2 are already part of the categories of non-Hungarians and native Hungarian speakers. In 2021, 81.2% (403,140 people) of the Hungarian population belonged to the core group; 3.8% (18,925 people) were of Hungarian nationality and non-Hungarian mother tongue; 11.9% (59,035 people) were of non-Hungarian nationality and Hungarian mother tongue; and 3.1% were of Hungarian second nationality and non-Hungarian mother tongue (15,190 people). (See Diagram 6/Table F4.) In 2021, a total of 496,290 persons declared themselves as Hungarian in at least one of the three questions on ethnic affiliation.
Diagram 6: The distribution of Hungarians in Slovakia according to the number of belonging to each type
Diagram 5 shows that a part of those belonging to nationality 2 are already part of the categories of non-Hungarians and native Hungarian speakers. In 2021, 81.2% (403,140 people) of the Hungarian population belonged to the core group; 3.8% (18,925 people) were of Hungarian nationality and non-Hungarian mother tongue; 11.9% (59,035 people) were of non-Hungarian nationality and Hungarian mother tongue; and 3.1% were of Hungarian second nationality and non-Hungarian mother tongue (15,190 people). (See Diagram 6/Table F4.) In 2021, a total of 496,290 persons declared themselves as Hungarian in at least one of the three questions on ethnic affiliation.
Diagram 6: The distribution of Hungarians in Slovakia according to the number of belonging to each type
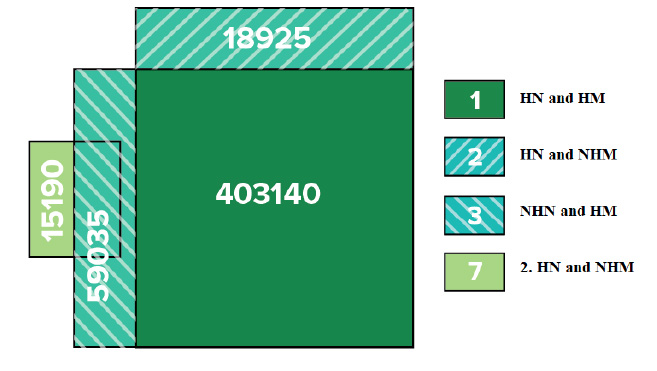 The hierarchical structure of each type is illustrated in Diagram 7. In all probability, those belonging to the core group have the most intense indicators of belonging to the Hungarians, while in the case of the second nationality, this attachment is much looser, presumably more symbolic in most cases.
Diagram 7: Types of belonging to Hungarians in Slovakia according to ethnic attachment, 2021
The hierarchical structure of each type is illustrated in Diagram 7. In all probability, those belonging to the core group have the most intense indicators of belonging to the Hungarians, while in the case of the second nationality, this attachment is much looser, presumably more symbolic in most cases.
Diagram 7: Types of belonging to Hungarians in Slovakia according to ethnic attachment, 2021
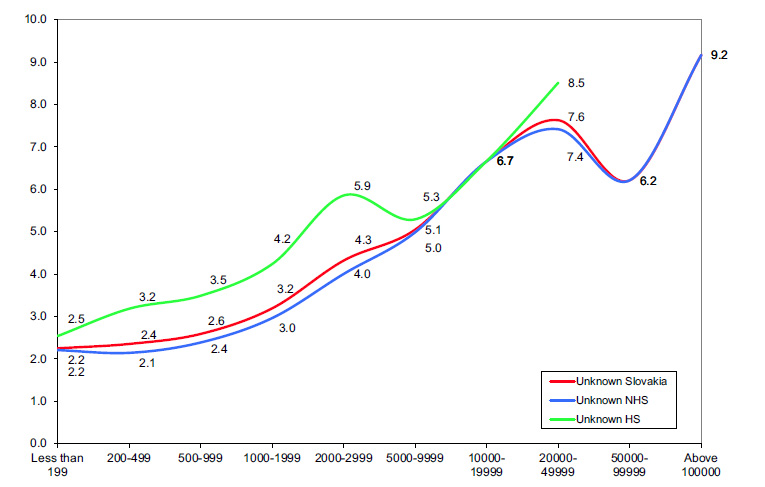 The data show that in HS with a population of fewer than 5,000 the proportion of unknowns is higher than the national rates; in small towns of HS (5,000–19,999) the proportion of unknowns is the same as the national; and in the largest settlements, where the proportion of Hungarians is very low but the national population is significant, the proportion of unknowns is very high. Based on these, it is assumed that the share of unknowns in the population of HS may be around the national rate.
In a further calculation, the unknowns were distributed among the nationalities in proportion to the ethnic composition of the population of the localities. As a result, the share of Hungarians of unknowns in the identified settlements could be around 22,556 (i.e., the expected number of Hungarians is 5.3% higher than the registered number).
In a similar way, the same calculation was made for mother tongue affiliation. In other words, the share of Hungarian-speaking people in the unknowns is estimated to be around 26,039 people. The expected number of native Hungarian speakers is 5.6% higher than their registered number. In this way, the expected number of Hungarians can be around 444,621, and the number of Hungarian native speakers around 488,214. (Table F7)
In the following, we estimate the proportion of unknowns in relation to Hungarian second nationality. In the case of second nationality, the proportion of unknowns at the national level is 11.6%.
The proportion of unknowns for second nationality is 11.6% at the national level. In their case we have to take an additional step absent from the previous analyses. As already mentioned above (Figures 3 and 6), fewer than half (44.6%, 15,190 people) of those who identify themselves as Hungarian as a second nationality (34,089 people), increase the number of those with Hungarian affiliation, since the majority of them (18,899 persons) who declared themselves as native Hungarian speakers are already included in the NHN and HM categories. Of these, the “surplus of Hungarians” can be estimated at 4,200, based on the procedure described above. Of these, 1,872 people (44.6% of the 4,200 people) are considered to be in the second HN and NHN categories. The “yield” of the Hungarians from the unknown second HNs is based on probability data to a greater extent than the previous calculations, but given the relatively small value, it increases the inaccuracy of the estimate to an almost negligible extent. Thus, the estimated number of Hungarian second nationality and non-Hungarian mother tongue is 17,062 people (i.e., 15,190 + 1,872).
Finally, we determine the expected number of people assuming themselves as Hungarian according to at least one indicator, based on the available registered data, and taking into account the proportions and correlations between the registered data. Taking these into account, the number of Hungarian persons with at least one indicator of Hungarian affiliation can be estimated at 520,291, which includes the share of Hungarians in the unknowns. (Table F7.)
The data show that in HS with a population of fewer than 5,000 the proportion of unknowns is higher than the national rates; in small towns of HS (5,000–19,999) the proportion of unknowns is the same as the national; and in the largest settlements, where the proportion of Hungarians is very low but the national population is significant, the proportion of unknowns is very high. Based on these, it is assumed that the share of unknowns in the population of HS may be around the national rate.
In a further calculation, the unknowns were distributed among the nationalities in proportion to the ethnic composition of the population of the localities. As a result, the share of Hungarians of unknowns in the identified settlements could be around 22,556 (i.e., the expected number of Hungarians is 5.3% higher than the registered number).
In a similar way, the same calculation was made for mother tongue affiliation. In other words, the share of Hungarian-speaking people in the unknowns is estimated to be around 26,039 people. The expected number of native Hungarian speakers is 5.6% higher than their registered number. In this way, the expected number of Hungarians can be around 444,621, and the number of Hungarian native speakers around 488,214. (Table F7)
In the following, we estimate the proportion of unknowns in relation to Hungarian second nationality. In the case of second nationality, the proportion of unknowns at the national level is 11.6%.
The proportion of unknowns for second nationality is 11.6% at the national level. In their case we have to take an additional step absent from the previous analyses. As already mentioned above (Figures 3 and 6), fewer than half (44.6%, 15,190 people) of those who identify themselves as Hungarian as a second nationality (34,089 people), increase the number of those with Hungarian affiliation, since the majority of them (18,899 persons) who declared themselves as native Hungarian speakers are already included in the NHN and HM categories. Of these, the “surplus of Hungarians” can be estimated at 4,200, based on the procedure described above. Of these, 1,872 people (44.6% of the 4,200 people) are considered to be in the second HN and NHN categories. The “yield” of the Hungarians from the unknown second HNs is based on probability data to a greater extent than the previous calculations, but given the relatively small value, it increases the inaccuracy of the estimate to an almost negligible extent. Thus, the estimated number of Hungarian second nationality and non-Hungarian mother tongue is 17,062 people (i.e., 15,190 + 1,872).
Finally, we determine the expected number of people assuming themselves as Hungarian according to at least one indicator, based on the available registered data, and taking into account the proportions and correlations between the registered data. Taking these into account, the number of Hungarian persons with at least one indicator of Hungarian affiliation can be estimated at 520,291, which includes the share of Hungarians in the unknowns. (Table F7.)
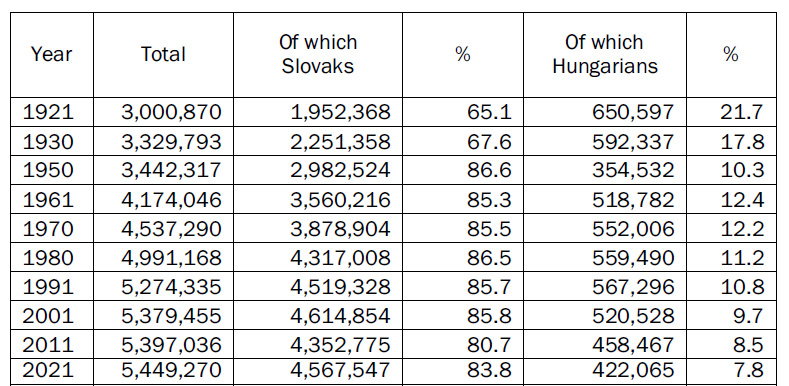 Table F2: The number and proportion of Hungarian and Slovak population according to mother tongue in Slovakia in 1970, 1991, 2001, 2011, and 2021
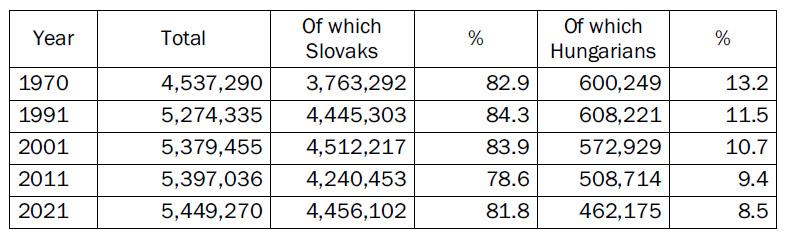 Table F3: Distribution according to nationality and mother tongue in 2001, 2011, and 2021
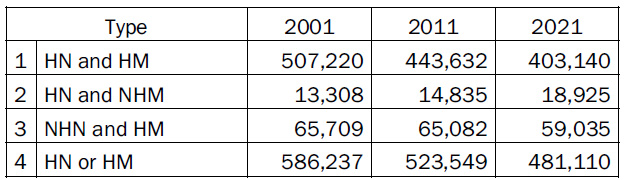 Table F4: The distribution of population with Hungarian attachment in Slovakia according to their types, 2021
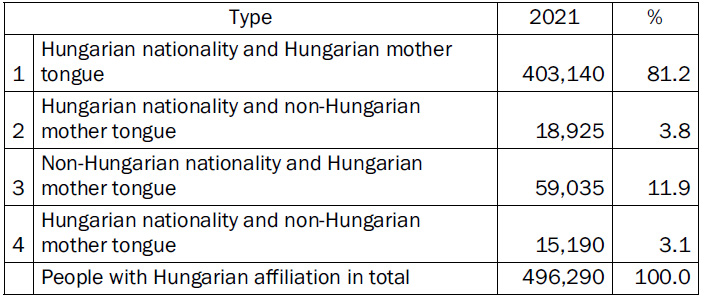 Table F5: The proportion of unknowns according to the size groups of settlements in 2011 and 2021 (%)
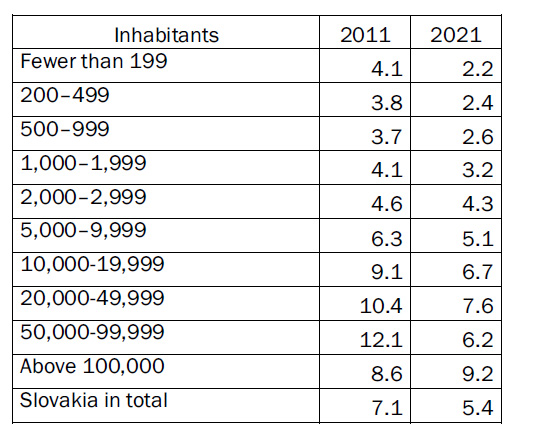 Table F6: The proportion of Hungarians according to the size groups of settlements in Slovakia, 2021 (%)
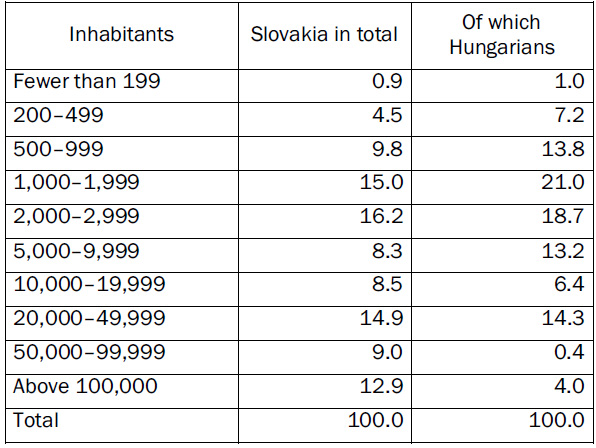 Table F7: The distribution of expected number of population with Hungarian attachment in Slovakia according to their types, 2021
In January 2021, the Slovak Statistical Office presented the first results of the previous year’s census, more precisely the census of persons, houses, and dwellings. According to the published data, the population of Slovakia is 5,449,270, which means an increase of 52,234 compared to the previous census in 2011. This was the second smallest population increase in the history of Slovak (and also Czechoslovak) censuses in the post-World War II period. The only smaller increase in population was in the decade before, with 17,581 people.
The 2021 census differed from the previous ones in several respects. It was conducted entirely electronically. The census of houses and dwellings—which started on 1
* The author gratefully acknowledges the contribution of the Slovak Research and Development Agency under the project APVV-20-0336 Transformations of the Community of Hungarians in Slovakia over the Last Hundred Years, with Special Emphasis on Their Everyday Culture.
June 2020 and was completed by 12 February 2021—was entirely the responsibility of the localities (i.e., towns and villages) without direct participation of the population.
The first phase of the census lasted from 15 February to 31 March, and the second assisted phase from 3 May to 13 June. During the census, part of the data on the population were provided from available official administrative databases. The rest of the data was derived directly from the population, who answered questions on a form on the website of the statistical office, with the help of assistants during the assisted phase. The novelty of the 2021 census is that for the first time participants’ so-called “second nationality” was also asked. Of the population, 5.6% (306,175 people) declared themselves as belonging to a second nationality.
In our dissertation, we examine the components affecting the number of the Hungarian population in the 2021 census, such as the correlations between nationality and mother tongue, which was further modulated by the question of the second nationality introduced in 2021. We also attempt to clarify the issues arising from the high number and proportion of non-respondents and unknowns.
The Slovak and Czechoslovak censuses always asked about the nationality of the population. In contrast, the mother tongue (besides the constant inquiry about nationality) was asked only five times (in 1970, 1991, 2001, 2011, and most recently in 2021). The second nationality, as already mentioned, was asked for the first time in the 2021 census.
What we mean by nationality or mother tongue is first approached by using the de finitions from the Slovak census.
“By nationality we mean the belonging of a person to a particular nation, national or ethnic minority. Neither the mother tongue nor the language that the citizen uses or knows best is decisive for the determination of nationality, but his or her own convictions and decisions. The nationality of children under the age of 15 must be indicated according to the nationality of the parents. If the parents claim to be of different natio nalities, the nationality of one of them (chosen by mutual agreement) should be entered. In the other box, enter the actual nationality not shown here.” Definition used in the 2021 census: “Nationality means the belonging of a person to a nation, a natio nal minority or an ethnic group.”
“Mother tongue means the language most commonly spoken by the parents of the respondent during childhood. If the language of the parents is different, the mother tongue of the child shall be the language in which the mother spoke to the child. The data on the mother tongue need not be the same as on the nationality. Enter in the other box the actual mother tongue of the child not indicated here.” Definition used in the 2021 census: “The mother tongue is the language spoken by the resident’s parents when he/she was a child.”
As it turns out from the definitions, in assessing nationality, the individual’s belonging to a national community is determined by the respondent’s conviction and determination, and it is not relevant which language he or she considers to be his or her mother tongue, or which language he or she speaks better. The question of mother tongue is more straightforward than the nationality, in that it asks in fact what language is spoken to the child by his or her parents, or in the case of parents of different languages, by his or her mother during his or her childhood. This relatively clear definition of mother tongue is by no means automatic in the social sciences. Social researchers use the concept of mother tongue in several senses.
In principle, the definition of the Slovak Statistical Office also provides an opportunity to declare the mother tongue of people with a significant degree of dual citizenship who grow up in two language cultures in accordance with the actual situation.
The identification of ethnic affiliation at the level of nationality and mother tongue data in Slovak and Czechoslovak census practice differs in several respects. In Slovakia, but also in the wider region, the category of national belonging carries a much stronger political connotation than that of mother tongue.
The morphosis of the number of particular nationalities has been a constant issue in domestic politics. It has been the subject of particular attention at the time of each census. Census data were also used as a tool for ethnic cleansing in the years following World War II. The category of nationality was included on various data sheets and forms, and in the socialist Czechoslovak era on identity cards.
As a result, the data on mother tongue provide a more faithful picture than the data on the declaration of nationality about the number of people belonging to the Hungarians as a cultural community in Slovakia and their distribution of the settlement and the social structure. (The same can be assumed for other national minorities.)
Examining ethnic affiliation on the basis of two variables also provides an opportunity for a more complex analysis of the processes of ethnic change in the period between the two most recent censuses. It also allows one to detect whether the processes of ethnic change in one direction or another have increased or decreased during the period under study.
The novelty of the 2021 census is to ask about the second, other nationality (hereafter referred to as second nationality). Certain aspects of the assumption of a second nationality affiliation are pointed out below, but it will be up to future studies to clarify the context for the interpretation of this indicator.
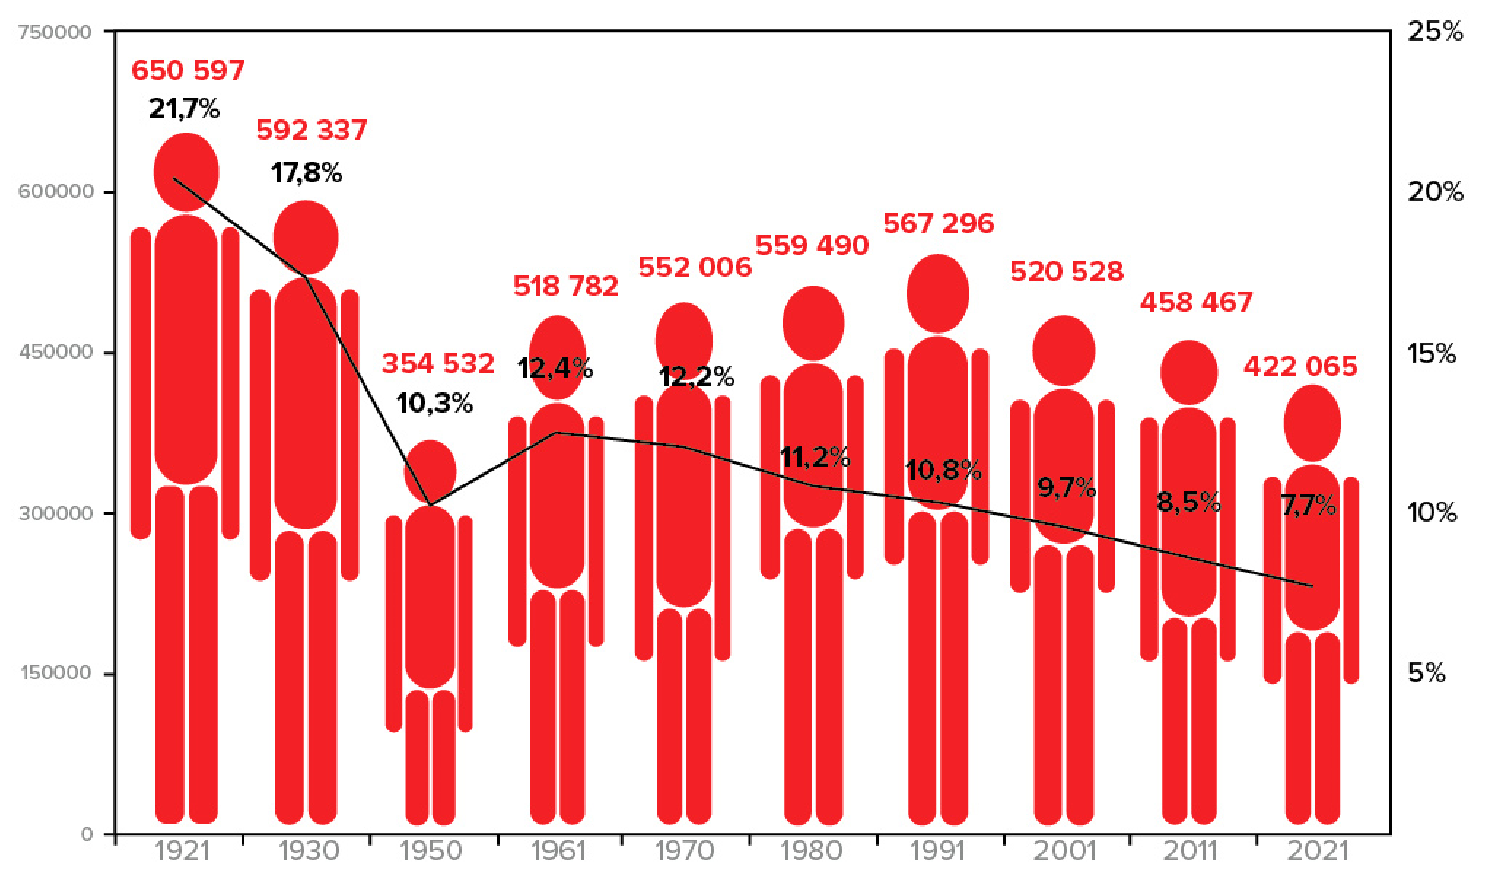
Between 1921 and 2021, the number of the Hungarian population in Slovakia decreased from 650,597 to 422,065 (i.e., by 228,532 people or 35.1%). During the same period, the number of the Slovak population increased from 3,000,870 to 5,449,270 (i.e., by 2,448,400 people or 81.6%). The change in the Hungarian population between 1921 and 2021 was not continuous. The number of people of Slovak nationality increased from 1,952,368 to 4,567,547, with 2,615,179 inhabitants, an increase of 134.0%. (See also Table F1.)
Diagram 1: The change in number and proportion of hungarian population between 1921 and 2021
1.) Between 1921 and 1950, the number of Hungarians decreased. After the First World War, the decline can be explained by the relocation of some of the Hungarian middle classes to Hungary, often only by a statistical change of nationality of those with multiple nationalities, and by the “statistical separation” of a part of the Jewish population from the Hungarian population. During the Second World War and in the following years, contradictory processes took place: in the areas reannexed to Hungary, some of the mixed-heritage population reasserted their Hungarian identity, but the number of Hungarians was reduced by the Jews deported to extermination camps. The number of Hungarians decreased the most in the second half of the 1940s due to deportations, population changes, and reslovakization. It is not a coincidence that in the 1950 census, the number of Hungarians was 237,805 lower than it had been in 1930.
2.) Between 1950 and 1991, the number of Hungarians increased in each decade at a decreasing rate. The exceptionally high increase in the 1950s can be traced in part to high natural reproduction, and to a much greater extent to the Hungarian commitment of the previously reslovakized Hungarians. In the 1960s, the significant natural increase was supplemented by the “statistical return” of some of those who had assumed Hungarian identity. In the 1970s and 1980s the assimilation and change of nationality processes significantly reduced the natural reproduction rate, which had already declined but was still significant. At the same time, in the period between the change of regime and the 1991 census, a part of those who had previously identified themselves as Slovaks—with a diverse territorial and age composition—identified themselves as Hungarians. On the other hand, the 1991 census extended the list of nationalities, including the category of Roma. A not insignificant proportion of those who declared themselves as Roma had declared themselves as Hungarian in previous censuses.
3.) The third phase in the demographic history of the Hungarian population in Slovakia is the period from the 1990s to the present, which is characterized by a significant decline in the number of Hungarians.
Between 1991 and 2001, the number of Hungarians decreased by 47,000, between 2001 and 2011 by 62,000, and between 2011 and 2021 by 36,000.
However, during the last three censuses, we had to deal with a previously non-existent problem regarding the change of the number of nationalities. While at the time of the 1980 and earlier censuses, the proportion of unknowns (i.e., those who did not declare their ethnicity) was statistically negligible, in 1991 there were 8,782 people, in 2001 54,502 people (i.e., 1% of the population), and in 2011 382, 493 (i.e., 7% of the population) who did not declare their nationality. In 2021, the number of non-respondents to the question on nationality decreased to 295,558, and their share in the total population fell to 5.4%.
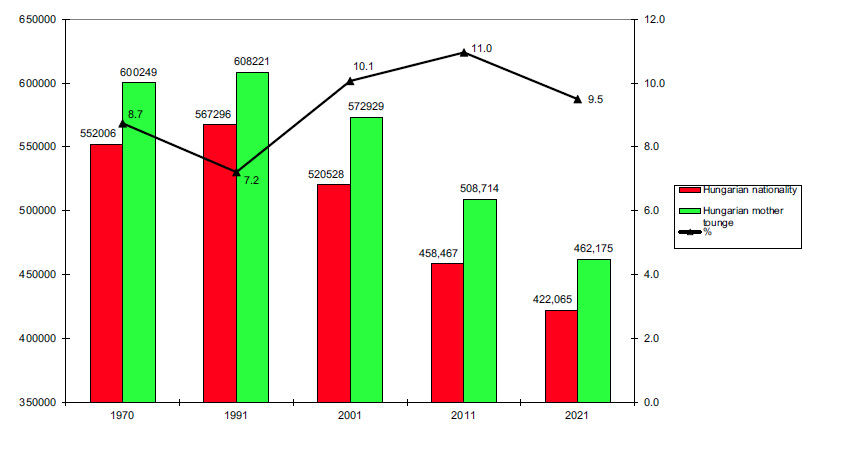
The (Czecho)Slovak censuses asked not only about nationality but also on five occasions (1970, 1991, 2001, 2011, and 2021) about mother tongue. According to the mother tongue, the number of the Hungarian population was 600,249 in 1970. The highest number was recorded in 1991 (608,221), and in the following years their number decreased almost in parallel with the nationality data. In 2021, 462,175 Hungarian native speakers were counted. The proportion of native Hungarian speakers in the total population is not significantly higher than that of Hungarians. In 1970, 13.2% of the population, in 1991 11.5%, in 2021 8.5% were native Hungarian speakers. (Figure 2, Table F2.)
The size of the difference between these two indicators of nationality can be explained by a variety of factors, including shifts in the proportion of mixed marriages and changes in the political situation of minorities.
There is a specific correlation between nationality and mother tongue data for each nationality: the number of members of the majority nation is higher according to nationality, and the number of national minorities, including Hungarians, is higher according to mother tongue. One could also say that nationality is a kind of “official data,” given the fact that different forms include a question on nationality, while the mother tongue category does not. The ratio of the two data points (and the difference between the two) indicates the consistency of the nationality. The smaller the difference between these two indicators, the more solid the national affiliation of members of each nationality is perceived to be. The number of Hungarians based on mother tongue data was 8.7% higher in 1970 and 9.5% higher in 2021 than the number based on ethnicity. The two data points differed the least in 1991 (i.e., by 7.2%). It is assumed that a kind of positive vision of the future, which strengthened in the short period after the regime change, may have contributed to the catching-up of the number of ethnic Hungarians with the number of native Hungarian speakers. In 2001, 1.2% of the population did not respond to the question on mother tongue affiliation, in 2011 7.5%, and in 2021 5.4%.
Diagram 2: The number of Hungarians according to nationality and mother tongue, 1970–2021
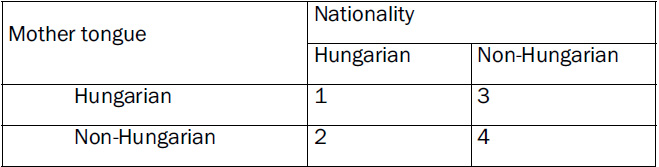
The dilemma of mother tongue versus nationality can be approached in a more nuanced way by looking at the combinations of the two variables. In the first approach, we treat both variables as dichotomous ( Hungarian and non-Hungarian); thus we examine four combinations (or types) of the dichotomy of mother tongue and nationality variables.
Table 1. Types of the distribution by nationality and mother tongue
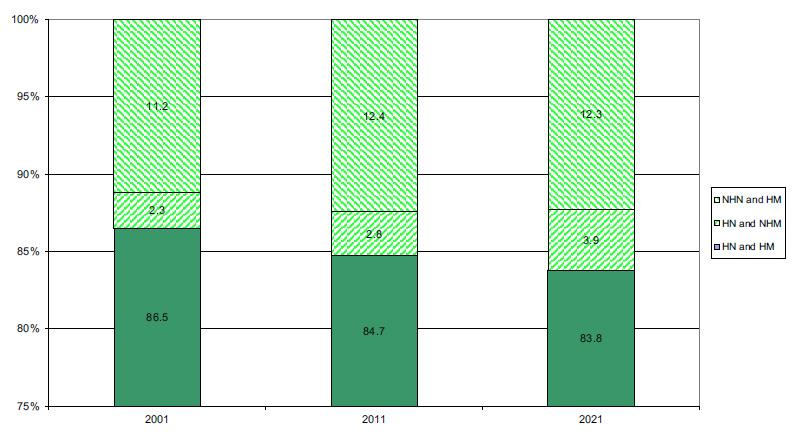
Of the four types, the least problematic is to consider those who declared themselves Hungarian according to their nationality and mother tongue (HN = Hungarian Nationality; HM = Hungarian Mother Tongue) as belonging to the Hungarian national community. Similarly, at least on an analytical level, we do not consider those who did not assume either Hungarian nationality or Hungarian mother tongue according to either of these two indicators as Hungarian (NHN = Non-Hungarian Nationality; NHM = Non-Hungarian Mother Tongue). However, the number of those who are Hungarian only according to one of the identification indicators is not negligible. For the Hungarians in Slovakia, the number of non-Hungarian nationality and of Hungarian tongue (NHN and HM) is a fraction of about one-third to one-fifth of the number of those who declared themselves as belonging to Hungarian nationality and non-Hungarian mother tongue speakers (HN and NHM). Our data on the combination of the two variables are only available for the last three censuses.
Diagram 3: Types of belonging to Hungarians according to nationality and mother tongue, 2001–2021
If we then try to draw a more nuanced picture of the ethnic composition of Hungarians in Slovakia, we would have to say that a kind of core group of Hungarians in Slovakia are those who declared themselves Hungarian in terms of both indicators (507,220 people in 2001, 443,632 people in 2011, and 403,140 people in 2021). However, the Hungarian population in Slovakia also includes, to a greater or lesser extent, a significant number of other persons (79, 017 in 2001, 79,917 in 2011, and 77,960 in 2021) who declared themselves Hungarian according to only one of the indicators in the last three censuses. Thus, the census-data-based number of persons with a smaller to larger Hungarian community affiliation—a kind of „ethnic potential”—was 586,237 [this number seems to be inaccurate] in 2001, 52,349 in 2011, and 48,111 in 2021 (see Table F3).
The separation and delimitation of these two additional smaller groups would require further elaboration. It seems a simpler task to delimit group 3 according to Table 1, those with non-Hungarian (Slovak) nationality and Hungarian mother tounge. Based on an ethnicity study carried out in 2000, it is known that about one-fifth of those from mixed Hungarian–Slovak marriages were Hungarian by ethnicity and fourfifths were Slovak, while the ratio was around 1:2 by mother tongue. Similarly, 73% of those of Hungarian origin who had received education in a non-Hungarian language declared themselves to be of Hungarian nationality, but 83% claimed to be Hungarian mother tongue speakers. By other indicators of dual affiliation (language skills, cultural consumption, etc.), more people belonged to the Hungarian community than to the
Hungarian nationality. (Data from a survey carried out in 2000; see Gyurgyík 2004.) The other type of the study on mother tongue/nationality dichotomy, the group of Hungarian nationality and Slovak mother tongue speakers, is perhaps a more difficult group to define. It is probable that in terms of belonging to the Hungarian national community, they are located between the “core group” (Hungarian nationality and Hungarian mother tongue) and the external sphere (Slovak nationality and Hungarian mother tongue). Some of them are of mixed origin, who are of Hungarian nationality but not native Hungarian speakers, in other words those of homogeneous Hungarian origin who were socialized in a more Slovak language environment but have retained their national affiliation according to their origin. Further, the number of those belonging to this group was increased by those of Roma origin who (in addition to their Hungarian nationality) indicated Roma as their mother tongue.
If we examine the development of the three types of belonging to the Hungarians in the three censuses, it is observable that the proportion of those belonging to the core group who were Hungarian according to at least one indicator decreased by a not insignificant amount, from 86.5% to 83.8%. On the other hand, the proportion of the two groups of Hungarians according to only one indicator increased. The group of those of Hungarian nationality and Slovak mother tongue shows a more intensive growth (from 2.3% to 3.9%) than the group of those of Slovak nationality and Hungarian mother tongue (from 11.2% to 12.3%).
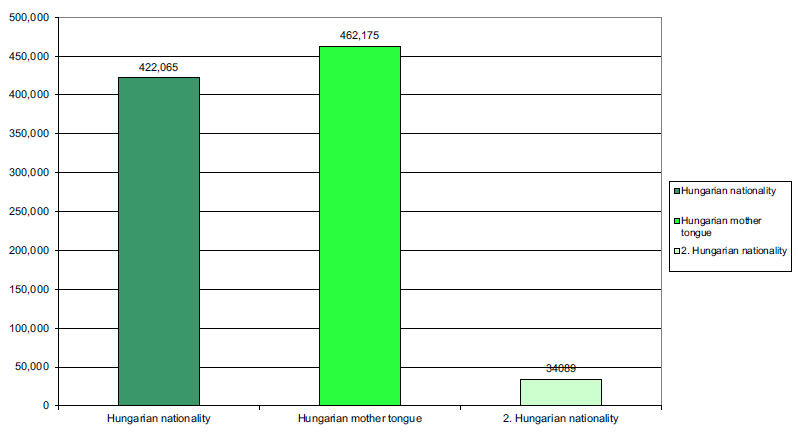
In the 2021 census, 422,065 persons declared themselves as Hungarian, 462,175 persons declared themselves as native speakers of Hungarian, and 34,089 persons indicated Hungarian nationality as their second nationality. The number of native Hungarian speakers was 9.5% higher than the number of ethnic Hungarians. The possibility of assuming second nationality provided, in principle, an opportunity to increase the number of people belonging to each national community. The difference between the share of nationality and mother tongue data in 2021 is similar to that of the previous decades. This confirms the assumption that in 2021 the possibility of assuming the second nationality did not significantly affect the number of Hungarian nationalities.
Diagram 4: The Hungarian population by Hungarian nationality, mother tongue, and Hungarian second nationality in 2021
In order to examine the interrelations and interactions of the three variables indicating ethnic attachment, we need to consider the interrelations of ethnicity and mother tongue in addition to the interrelations shown in Table 1. As can be seen from Table 2, from the point of view of Hungarians, two combinations have a meaningful Hungarian connotation in relation to the second nationality: the combination of the Hungarian second nationality and Hungarian mother tongue (5), and of the Hungarian second nationality and non-Hungarian mother tongue (7). Those belonging to the combination of Hungarian nationality and Hungarian mother tongue (5) are already included in the combination of non-Hungarian nationality and Hungarian mother tongue (3) described in Table 1 (3). (Combinations 6 and 8 have no Hungarian relevance.)
Table 2. Types of the distribution by second nationality and mother tongue
The correlations of the three variables of ethnicity with respect to affiliation to Hungarian community are illustrated in Diagram 5.
Diagram 5: The distribution of Hungarians in Slovakia according to their types, 2021
Diagram 5 shows that a part of those belonging to nationality 2 are already part of the categories of non-Hungarians and native Hungarian speakers. In 2021, 81.2% (403,140 people) of the Hungarian population belonged to the core group; 3.8% (18,925 people) were of Hungarian nationality and non-Hungarian mother tongue; 11.9% (59,035 people) were of non-Hungarian nationality and Hungarian mother tongue; and 3.1% were of Hungarian second nationality and non-Hungarian mother tongue (15,190 people). (See Diagram 6/Table F4.) In 2021, a total of 496,290 persons declared themselves as Hungarian in at least one of the three questions on ethnic affiliation.
Diagram 6: The distribution of Hungarians in Slovakia according to the number of belonging to each type
The hierarchical structure of each type is illustrated in Diagram 7. In all probability, those belonging to the core group have the most intense indicators of belonging to the Hungarians, while in the case of the second nationality, this attachment is much looser, presumably more symbolic in most cases.
Diagram 7: Types of belonging to Hungarians in Slovakia according to ethnic attachment, 2021
So far, the number of people belonging to the Hungarian population has been examined on the basis of the data registered in the census. Since a not insignificant part of the population did not answer the question on nationality or mother tongue (5.4% and 5.7%, respectively), we will try to estimate the number of non-respondents who can be considered as belonging to the Hungarian minority on the basis of statistical methods. In other words, people registered in the census are basis for the official nationality data. At the same time, data on the ethnicity of a significant proportion of those who did not fill in the census questionnaire are not recorded. In the following, statistical procedures are used to estimate the proportion of those who were not recorded in this way in the census.
The question arises as to how much higher the number of Hungarians would be if all residents had filled in the questionnaire and answered the questions about ethnicity. It is known from the studies of previous census data that the proportion of unknowns in the settlements is correlated with the size of the settlements: the larger the population of the settlement is, the more non-respondents there are (Gyurgyík 2014). This is also confirmed by the data for 2011 and 2021 (Table F5).
As the degree of urbanization of the Hungarian population differs from that of the national, we can assume that the share of Hungarians in the unknowns may be lower than the national share. (See Table F6.) On the other hand, we hypothesize that the nationality composition of settlements may also influence the proportion of nonrespondents. Therefore, we created two subgroups: the Hungarian settlements (HS) and the non-Hungarian settlements (NHS).
Diagram 8: The proportion of unknowns on Hungarian and non-Hungarian settlements
The data show that in HS with a population of fewer than 5,000 the proportion of unknowns is higher than the national rates; in small towns of HS (5,000–19,999) the proportion of unknowns is the same as the national; and in the largest settlements, where the proportion of Hungarians is very low but the national population is significant, the proportion of unknowns is very high. Based on these, it is assumed that the share of unknowns in the population of HS may be around the national rate.
In a further calculation, the unknowns were distributed among the nationalities in proportion to the ethnic composition of the population of the localities. As a result, the share of Hungarians of unknowns in the identified settlements could be around 22,556 (i.e., the expected number of Hungarians is 5.3% higher than the registered number).
In a similar way, the same calculation was made for mother tongue affiliation. In other words, the share of Hungarian-speaking people in the unknowns is estimated to be around 26,039 people. The expected number of native Hungarian speakers is 5.6% higher than their registered number. In this way, the expected number of Hungarians can be around 444,621, and the number of Hungarian native speakers around 488,214. (Table F7)
In the following, we estimate the proportion of unknowns in relation to Hungarian second nationality. In the case of second nationality, the proportion of unknowns at the national level is 11.6%.
The proportion of unknowns for second nationality is 11.6% at the national level. In their case we have to take an additional step absent from the previous analyses. As already mentioned above (Figures 3 and 6), fewer than half (44.6%, 15,190 people) of those who identify themselves as Hungarian as a second nationality (34,089 people), increase the number of those with Hungarian affiliation, since the majority of them (18,899 persons) who declared themselves as native Hungarian speakers are already included in the NHN and HM categories. Of these, the “surplus of Hungarians” can be estimated at 4,200, based on the procedure described above. Of these, 1,872 people (44.6% of the 4,200 people) are considered to be in the second HN and NHN categories. The “yield” of the Hungarians from the unknown second HNs is based on probability data to a greater extent than the previous calculations, but given the relatively small value, it increases the inaccuracy of the estimate to an almost negligible extent. Thus, the estimated number of Hungarian second nationality and non-Hungarian mother tongue is 17,062 people (i.e., 15,190 + 1,872).
Finally, we determine the expected number of people assuming themselves as Hungarian according to at least one indicator, based on the available registered data, and taking into account the proportions and correlations between the registered data. Taking these into account, the number of Hungarian persons with at least one indicator of Hungarian affiliation can be estimated at 520,291, which includes the share of Hungarians in the unknowns. (Table F7.)
In our study, we examined the composition of the Hungarian population in Slovakia based on nationality and mother tongue data. Based on an overview of their interrelationship, we have identified the types of Hungarians who belong to the Hungarian minority and the number of Hungarians who identify themselves as Hungarians on the basis of at least one indicator. By including data from a significant number of those who did not answer the questions on nationality, we also attempted to determine their expected number.
In the coming period, one of the possible tasks of studies of the Hungarian population in Slovakia could be to examine the demographic and social characteristics of the ethnic affiliations of the different types in the population.
Gyurgyík, László 2004. Asszimilációs folyamatok a szlovákiai magyarság körében. Pozsony, Kalligram.
Gyurgyík, László 2006. Népszámlálás 2001 A szlovákiai magyarság demográfiai, valamint település- és társadalomszerkezetének változásai az 1990-es években. Pozsony, Kalligram.
Gyurgyík, László 2012. Egy csökkenés anatómiája – A szlovákiai magyarság demográfiai folyamatai az 1990-es évektől napjainkig. Kommentár 2012/3, 25-35.
Gyurgyík, László 2014. A magyar nemzetiségűek településszerkezeti változásai az ezredfordulót követő évtizedben az ismeretlen nemzetiségűek adatainak a hátterében. Fórum Kisebbségtudományi Szemle, 2014/4, 57-72.
Sčítanie obyvateľov, domov a bytov 2001. Bývajúce obyvateľstvo podľa národnosti, podľa materinského jazyka a pohlavia za SR, kraje a okresy. SÚ SR 2002, p. 8. Further: Útmutató a személyi kérdőív kitöltéséhez.
Sčítanie obyvateľov, domov a bytov 2001. Definitívne výsledky za SR, NUTS2, kraje, okresy a obce. Bratislava, Štatistický úrad Slovenskej republiky.
Skutnabb-Kangas, Tove 1997. Nyelv, oktatás és kisebbségek. Kisebbségi adattár VIII. Budapest, Teleki László Alapítvány.
Metodika sčítania obyvateľov z hľadiska ich príslušnosti k národnosti alebo etniku so zreteľom
na materinský jazyk. SÚ SR, p. 27. Bratislava 2018. [https://www.scitanie.sk/o-scitani/zakladne-informacie-o-scitani-2021#i6]
[https://www.scitanie.sk/obyvatelia/zakladne-vysledky/pocet-obyvatelov/SR/SK0/SR]
[https://www.scitanie.sk/storage/app/media/dokumenty/vzor-formularahu.pdf]
[http://portal.statistics.sk]
Table F1: The number and proportion of Hungarian and Slovak population in Slovakia, censuses 1921–2021
Table F2: The number and proportion of Hungarian and Slovak population according to mother tongue in Slovakia in 1970, 1991, 2001, 2011, and 2021
Table F3: Distribution according to nationality and mother tongue in 2001, 2011, and 2021
Table F4: The distribution of population with Hungarian attachment in Slovakia according to their types, 2021
Table F5: The proportion of unknowns according to the size groups of settlements in 2011 and 2021 (%)
Table F6: The proportion of Hungarians according to the size groups of settlements in Slovakia, 2021 (%)
Table F7: The distribution of expected number of population with Hungarian attachment in Slovakia according to their types, 2021


 English