


 Magyar
Of the Czechoslovak censuses held after World War II, the ethnic data series of the 1950 census are of special importance. The nationality data of the censuses held du ring the party-state period were published only in national, region and district level in some, mostly internal publications of the Czechoslovak Statistical Office. Earlier census publications from 1950 and 1961 were still encrypted. The ethnicity data from the 1950 census are questionable in several ways. According to our calculations, the censuses held shortly after the deportations, reslovakization and population change showed that the number of Hungarians was 113 thousand lower than expected. (Gyurgyík 2011) In the post-World War II period, at all the national, regional and district levels the standing-ground for the particular nationalities and their territorial distribution is reported by the data from year 1961. However, the ethnicity data of Slovakia’s municipalities of the 1961 census (based on statistical office data and archival sources) are not known till this day.2
Nationality (and denominational) data of the 1950 census have only recently become available in the archives of the Slovak Statistical Office. The data were processed from 6 manuscript-type internal publications (hereinafter referred to as „publication”). The publications contain data on each region. Some data of particular settlements of each region are written on A2-size typewritten pages. (See Sčítanie ľudu 1950) The manuscripts containing the data of Slovakia’s municipalities represent the data of 6 nationalities in Slovakia. It indicates the Slovak, Czech, Russian, Polish, German and Hungarian nationalities, which are supplemented by the other category, which is a kind of cover category for Russian, Ruthenian Ruthenian and Ukrainian nationalities.
1. The morphosis of population
The population of Slovakia at the time of the 1950 census was 3 442 317. (Sčítání lidu a soupis domů 1950: 3) According to the 1930 census, its population was 3 329 793. (Sčítání lidu 1930: 23) That means that its number increased by 3.4% between 1930 and 1950. In the period between the 1930 census and the 1946 census, the population barely changed, in fact, slightly decreased. (3 327 803 in 1946; Tišliar–Šprocha 2017: 39) While the population growth was significant in the 1930s, the subsequent loss during the war levelled it out. There was a significant increase also in the international population in the years following the Second World War. Considering the period between 1946 and 1950 only, the population of Slovakia increased by 114,514 or 3.4%.3
The registered data of the number and proportion of nationalities in 1950 do not provide a credible picture from the point of view of the Hungarian, German, and Slovak population, due to the events affecting Hungarians and Germans in Slovakia in the second half of the 1940s. They are rather telling us that after a few years, the disenfranchisement how many people dared to declare themselves Hungarian (or German) at the time of the 1950 census. At the same time, the registered number of the Slovak population is significantly higher than expected.
The last Czechoslovak census before the 1950 one was carried out in 1930, two decades earlier. (In the 1940s, there was a Slovak census in the territory of the Slovak State on December 15, 1940. In Hungary and in the areas annexed to Hungary after the 1st Vienna Treaty (Vienna Award or Arbitration), including the Hungarian-inhabited areas in Slovakia, a census was held in 1941.) Especially during the “long forties” of these two decades often contradictory processes influenced the lives of different social groups and nationalities of the population, and “községsoros” (i.e. municipal) demographic consequences we did not have data on.4 (Entry and expulsion of so called ”anyások”5; deportation of Jews, Holocaust; forced departure of Czechs from Slovakia; departure of Slovaks and Czechs from the territories returned to Hungary; deportation of Hungarians and Germans; re-Slovakization of a significant part of the Hungarian population also significantly reshaped the ethnic composition of the Slovak population.) All these changes can be felt in the differences in ethnic data sets of the two censuses.
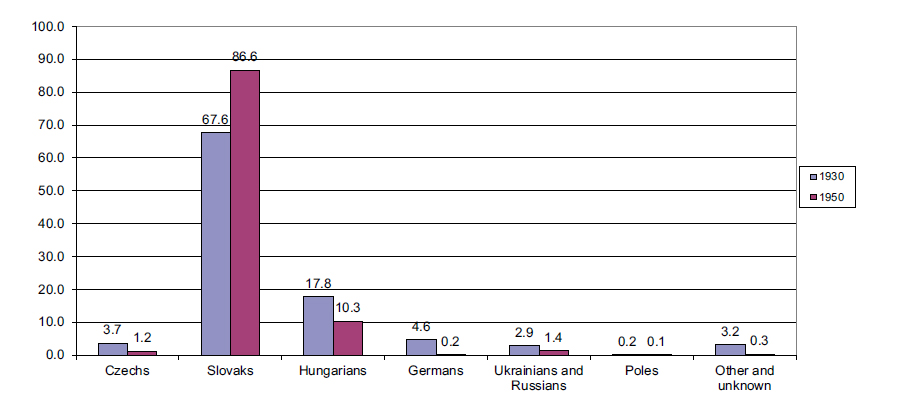
During the two decades (between 1930 and 1950), the registered number of Slovaks increased unrealistically from 225,138 to 298,254 by 73,116 people, or 32.5%. Their proportion increased from 67.6% to 86.6%. The number and proportion of other identified nationalities decreased. The number of Hungarians decreased from 592,337 to 354,532, by 237,805 people, by 40.2%, and their proportion decreased even more from 17.8% to 10.3%. The number of Czechs fell by 1/3 from 121,696 to 40,365, and their number from 3.7% to 1.2%. The number of Germans dropped to 1/30 in 1950, from 154,821 to 5,179. Their statewide share shrank from 4.6% to 0.2%. But the number and proportion of other identified nationalities also declined. (See Table F1 in the Appendix.)6
The census held after the deprivation of the rights of Hungarians does not provide usable data on the Hungarian population, it rather provides information on how many people actually dared to confess their Hungarian identity in such a short time after the austereness affecting the Hungarians as a whole. (Gyurgyík, 2011)
1.1. Regions and districts
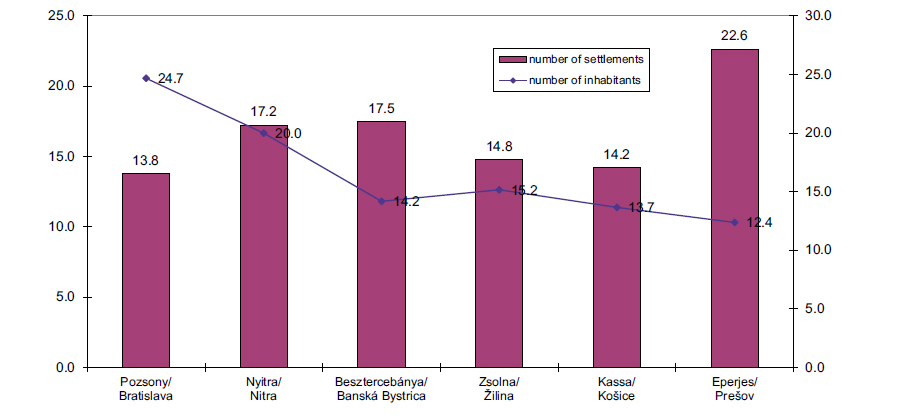
In 1950, at the time of the census, there were 3344 municipalities (villages and towns) in Slovakia. The number of localities and the population of Slovakia varied significantly considering the regions. The country was divided into 6 regions and at the lower level 91 districts. The number and proportion of localities (villages) and inhabitants of the regions differed significantly. Most settlements were located in the region of Eperjes (Prešov)7 (757), 22.6% of the settlements of Slovakia. The smallest number of settlements was found in the region of Pozsony (Bratislava) (460), which was 13.8% of the country’s localities. The distribution of the population is the opposite. Most of them lived in the region of Pozsony (Bratislava) (849,282 people) 24.7%, and half as many in the region of Eperjes (Prešov) (425,494 people) 12.4%. There is also a significant difference in the proportion of settlements and population of the region of Besztercebánya (Banská Bystrica). The localities belonging to the region of Besztercebánya (Banská Bystrica) accounted for 17.5% of the municipalities in Slovakia (584 settlements), while 14.2% of the country’s population lived in this region (487,903 people). The proportions of the localities and population of the other 3 regions are less divergent. (Diagram 2. See also Table F2 in the Appendix.)
The number of districts belonging to each region showed less variation. The Pozsony (Bratislava) region contained 17 districts, while the Kassa (Košice) region included 13. The number of municipalities within each district varies greatly. On average, 36.7 places (municipalities) are per region. There are two districts with only one locality (Pozsony [Bratislava] and Magas-Tátra [Vysoké Tatry]). Most of the localities were in the Kassa (Košice) region (93 municipalities). The highest number of inhabitants were found in Pozsony-város (Bratislava-mesto) which had a district status, with 192,896 inhabitants.8 5.6% of the Slovak population lived here. The region of Szepesóvár (Spišská Stará Ves) had the lowest population of 9,163 or 0.3% of the country’s population.
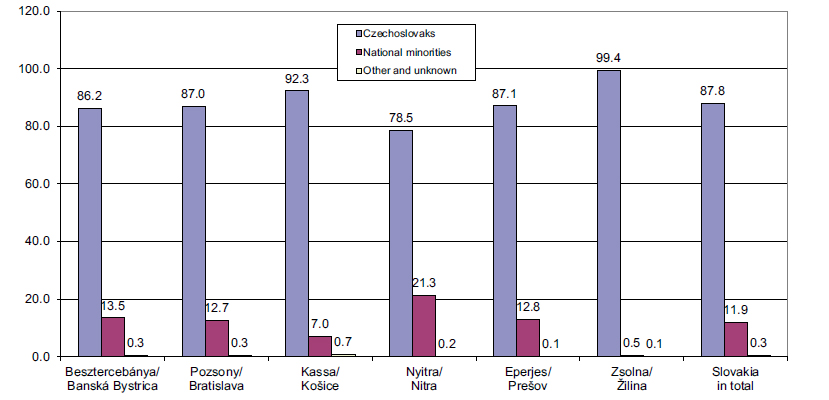
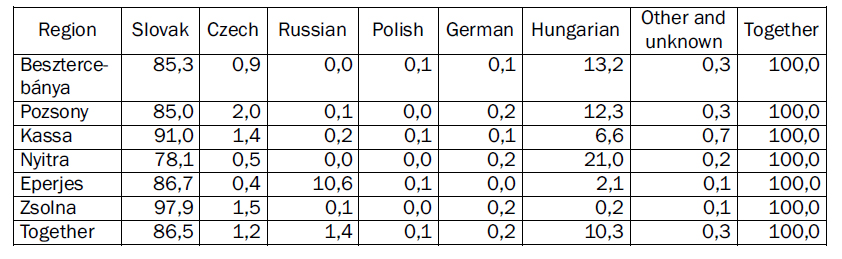
When examining of nationalities by regions, the nationalities are divided into two groups. (In addition, data for the very low proportion of other and unknown categories are also included). The majority nationalities include the Czechs and Slovaks, hereinafter referred to as “Czechoslovaks”, and the other registered nationalities are the “national minorities”. From the data we can see that the largest proportion of national minorities lived in the Nyitra (Nitra) region (21.3%) and the least in the Zsolna (Žilina) region (0.5%). In most regions, the proportion of national minorities exceeded 10%. Besztercebánya (Banská Bystrica) (13.5%), Pozsony (Bratislava) (12.7%), Eperjes (Prešov) (12,8%). After the Zsolna (Žilina) region, the proportion of minorities is the lowest in the Kassa (Košice) region (7.0%). The proportion of those in the category of others and unknowns is very low (0.1%-0.3%).
In the following we will review the composition of the ethnic configuration by district, that is, examine the ethnic distribution of each region. We use the following categorization to examine the ethnic configuration of the district.9
In 1950, 81 out of the 91 districts in Slovakia had a Czechoslovak majority, with only 10 regions not having a majority of Czechs and Slovaks. They formed a qualified majority in 69 out of the 91 districts. In most districts (in 59) nationalities were in diasporas. In 46 of these, their proportion was less than 2%, and in 13 districts their proportion varied between 2% and 10%. They were in 16 regions a slight minority and in 6 regions a strong minority. They were a slight majority in 10 districts. None of them were a qualified majority.
1.2. Size groups of settlements
The population living in Slovak settlements varied widely. Most of the inhabitants were from the city of Pozsony (Bratislava) (192,896 people), and the fewest lived in the village of Bálintfalva (Valentová, belonging to the Túrócszentmárton [Turčianský Svätý Martin] region, 32 people).
In the following, we examine the composition of the settlements according to the size groups of the population.
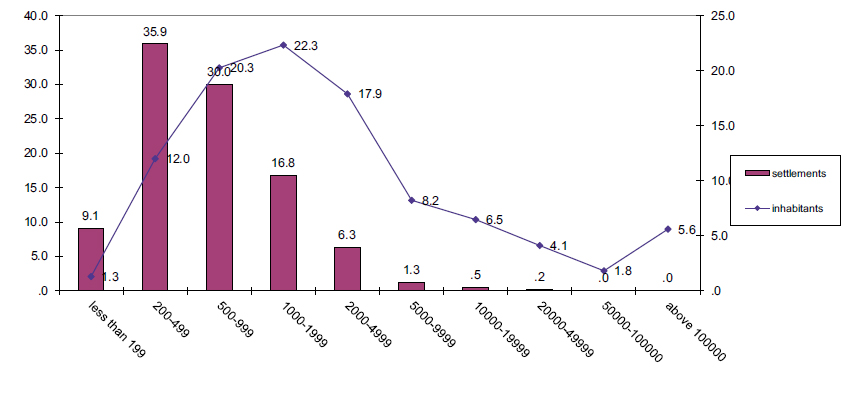
Three quarters of the settlements in Slovakia were settlements with less than 1000 inhabitants. The largest number was of the settlements with 200–499 inhabitants (1200, 35.9%), and the number of villages with 500–999 inhabitants (1002, 30.0%). There was a significantly lower number (562) and proportion (16.8%) of villages with 1000–1999 inhabitants. The number of localities with a population of more than 5,000, which can be considered urban, was very low (67 localities, 2%). Only the two largest cities (Pozsony [Bratislava] and Kassa [Košice]) had a population of more than 50,000. Nearly a quarter (22.3%) of the population lived in small villages with 1000–1999 inhabitants, more than fifth (1/5) in small villages with 500–999 inhabitants (20.3%), and 17.9% in places (municipalities) with 2000–4999 inhabitants. 18,8% of population lived in the cities with 5000–49999 inhabitants, 5,6% lived in Pozsony (Bratislava), and 1,8% lived in Kassa (Košice). (See also Table F3 in the Appendix)
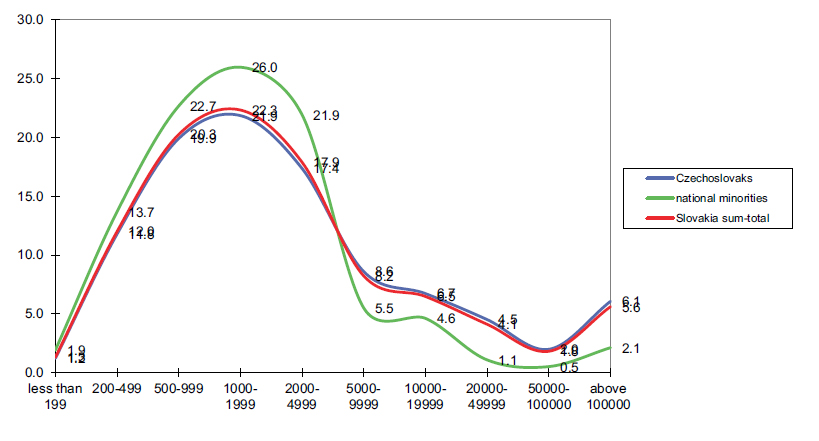
It can be observed within the population of Slovakia that the degree of urbanization of national minorities is lower than the national average. The proportion of national minorities is declining towards larger localities. Their proportion is higher in localities with a population of less than 5,000 than in the local population, and it is much lower in localities with a larger population. (See Table F3 in the Appendix)
Their proportion is the highest in settlements with a population of less than 200 (17.6%). But the decline is not continuous. Their rate is slightly lower in localities with 2000–4999 inhabitants (14.6%), while their scale (percentage) in localities with 500–1999 inhabitants ranges from 13% to 14%. Their proportion is much lower in localities with a population of more than 5,000. In cities with 5000–19999 inhabitants, their rate is above 8%, in cities with 20-100 thousand inhabitants it is above 3%, while in the only city with more than 100,000, Pozsony (Bratislava) is 4.5%. The difference between Czechoslovakians and national data is very small. Their proportion is higher in localities with a population of more than 5,000, while it is lower in localities with a lower population. This difference is only a few tenths of a percentage point. (Diagram 5)
2. Ethnic structure
So far we have classified the Slovak nationalities into two groups: we have distinguished the majority and minority nationalities. The first was the aggregate data of the Czechoslovakians (or “Czechoslovaks”), and the second was the aggregate data of the other nationalities (Hungarian, Russian, German, Polish and other nationalities). Let us examine the ethnic structure of these two groups of nationalities.
First we look at the number of settlements in which Czechoslovaks and those belonging to other national minorities live. In 1950, out of 3344 settlements, 3,339 had at least 1 inhabitant of Czechoslovak nationality. The missing 5 settlements were populated only by Russians. In the case of national minorities, at least 1 person belonging to one of the national minorities lived in 2018 settlements out of the 3344, i.e. the number of settlements inhabited by Czechoslovakians only was 1326.
2.1. Majority and minority nationalities
In the following, we will examine the proportion of the majority and minority nationalities in the settlements of Slovakia. The ethnic structure will be analysed on the basis of a 6-categories-criteria system.10
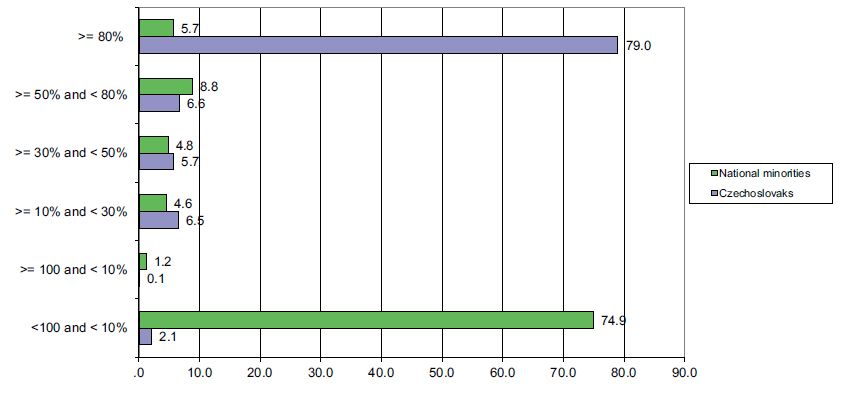
Czechoslovaks lived mainly in settlements (78.9%) where they formed a dominant majority (their proportion is higher than 80%). On the other hand the vast majority of settlements inhabited by national minorities (76.9%) were sporadic settlements, ie their proportion was lower than 10% in the vast majority of settlements inhabited by nationalities. In 1950, out of 2018 settlements inhabited by minorities, in 1220 settlements their rate did not reach 10%. Of the 3344 settlements, in 2546 settlements the proportion of nationalities was less than 10%.
The number of municipalities with a majority of national minorities was 485, i.e. 14.5% of the municipalities in Slovakia had a majority of national minorities. (Diagram 6)
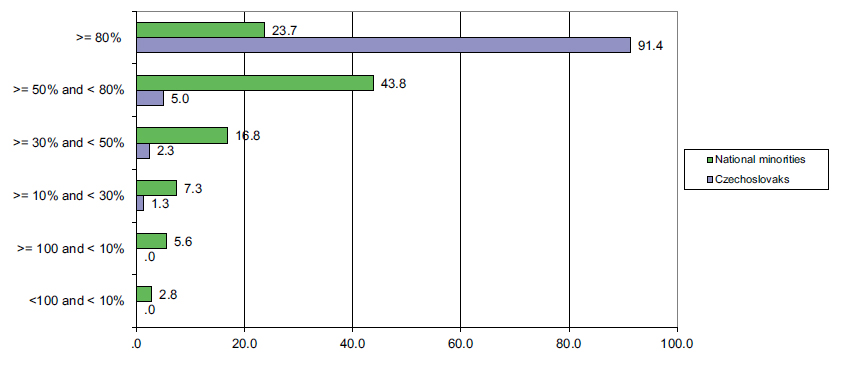
Compared to the previous approach, when we examined the distribution of settlements according to the proportion of nationalities, a much more striking feature of the ethnic structure is the distribution of nationalities according to the ethnic proportion (composition) of settlements. From this point of view, we can observe completely different characteristics: 8.4% of nationalities lived in sporadic and in sporadic settlements. By contrast, 67.4% of them in 1950 lived in settlements dominated by minorities. The proportion of the Czechoslovak population in sporadic settlements is almost negligible, 0.1%, it was also very low at 3.9% in the settlements inhabited by their minority. It accounted for 5.0% in the slight majority settlements and 91.4% in the strong majority settlements.
3. Ethnic composition of Slovakia
3.1. Regions
As mentioned, the 1950 census data of Slovakia’s municipalities showed data for 6 nationalities, supplemented by other and unknown categories. The 6 nationalities differed greatly in number as well as territorial distribution. Let us look at the morphosis of the number of individual nationalities by regions.
The proportion of Slovaks was the highest in the districts of Zsolna (Žilina) and Kassa (Košice) (97.9% and 91.0%). The proportion of Hungarians was the highest in the Nyitra (Nitra) region, 21.0%. The largest number of Russians lived in Eperjes (Prešov) region (10.6%) and the most of Czechs in the Pozsony (Bratislava) region (2.0%). The proportion of other nationalities is very low, none of them exceeding 0.1–0.2% in each region. (See also Table F2 in the Appendix)
3.2. Districts
In the following, we discuss the shaping of the distribution of Slovak nationalities by dist ricts. Our discussion, however, will be limited to those nationalities that constitute a significant proportion (at least 2%) in at least 1 district.
The proportion of one nationality, that of Poles does not reach 2% in any district, so we do not deal with their distribution by districts. The proportion of those in the other and unknown category is higher than 2% in two districts. Most probably, the Germans in the Késmárk (Kežmarok) district and some of the Hungarians in the Nagyrőce (Revúca) district did not declare their national affiliation and thus their proportion increased.
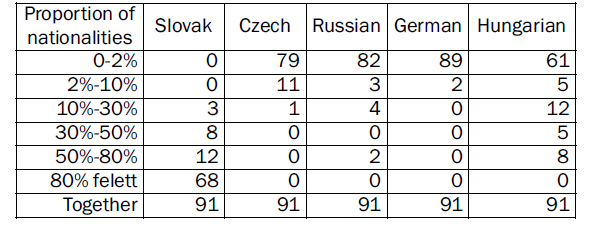
However, the distribution of the other 5 nationalities differs significantly. Slovaks were in the majority in 80 of the 91 Slovak districts. They had a qualified majority in 68 districts and a slight minority in 12 districts.
The proportion of Hungarians was lower than 10% in 66 districts, ranged from 10% to 50% in 17 districts, and made up the majority of the population in 8 districts, in none of which did they constitute a qualified majority.
The Russians were in a slight minority in 4 districts and in a slight majority in two districts. The proportion of Czechs was higher than 2% in 12 districts. In one of these districts (High Tatras), they were in a slight minority.
The proportion of Germans exceeded 2% in two districts: Stubnyafürdő (Turčianské Teplice) and Privigye (Prievidza).
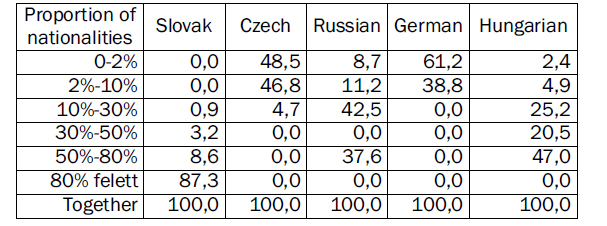
Now we examine the distribution of nationalities according to their proportion within districts. We can see from the data that the distribution of the nationalities involved in the study is quite diverse according to the ethnic composition of the districts. The vast majority of Slovaks (95.9%) lived in Slovak-majority districts. (Of these, their share is 87.3% in qualified majority districts and 8.6% in slight majority districts). 0.9% of them lived in strong minority districts. Nearly half of Hungarians (47.1%) lived in slight Hungarian-majority districts, and a similar proportion (45.7%) lived in Hungarian-mino rity districts. 7.3% of Hungarians lived in scattered districts. 37.6% of Russians lived in mild majority districts. 42.5% of them lived in mild minority districts and almost 1/5 (19.9%) in sporadic districts.
The vast majority of Czechs lived in sporadic districts. Only 4.7% lived in a district with a slight Czech minority (in the city of Pozsony [Bratislava]).
3.3. Settlements
Henceforwards, we examine the composition and distribution of nationalities in Slovakia and the development of the proportion of nationalities living in cities or towns at the level of settlements.
Firstly we examine how many settlements of each nationality were detected (in what proportion) in each settlement (i.e. we consider the municipalities where there lived at least one person from each nationality).
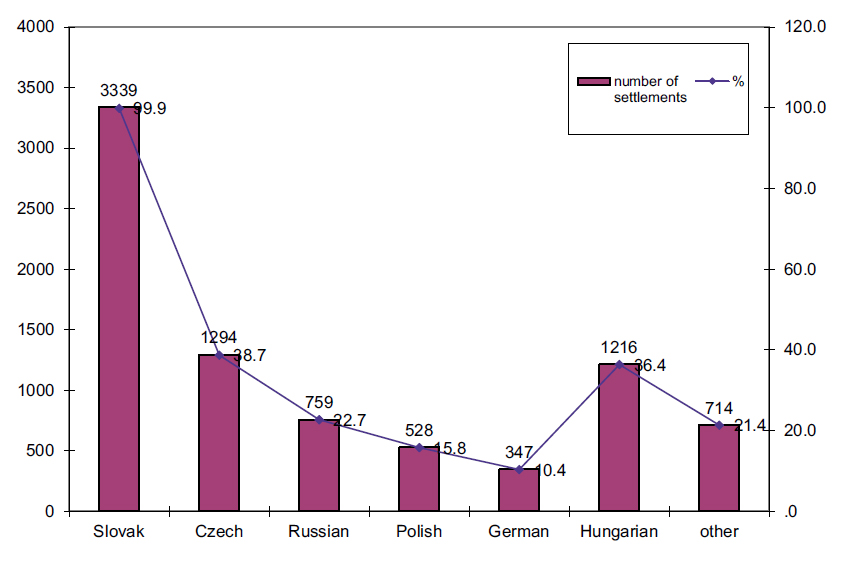
People of Slovak nationality lived in almost all settlements; in 1950, there were only 5 settlements (out of 3,344) without Slovak inhabitants, all of which were inhabited by Russians only. Czechs were present in 1294 municipalities, 38.7% of the settlements. Hungarians were found in a slightly smaller number of settlements, in 1216 municipalities (36.4%). Russians lived in 22.7% of settlements, Poles in 15.8% and Germans in 10.4%. (Other and unknown nationalities were detected in 21.4% of the localities).
3.3.1. Degree of urbanization
In what follows, we will look at the proportion of each nationality living in villages, respectively, towns. Whether members of a particular nationality will be considered rural or urban dwellers is not based on the legal status of the municipality in question; instead, settlements with less than 5,000 inhabitants are statistically considered to be villages and over 5,000 inhabitants are statistically considered to be towns. In Slovakia, in 1950, 26.2% of the population lived in cities or towns.
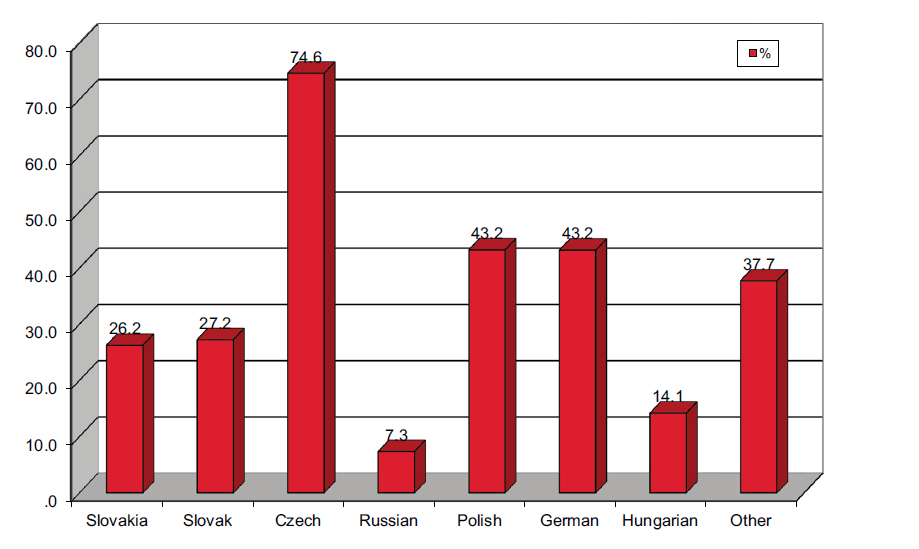
The under- and over-urbanization of each nationality compared to the country-wide average was very different. The Czechs were the most urbanized, with the largest proportion living in cities. Nearly ¾ (74.6%) of them lived in cities. This fact can be connected to the historical peculiarities of Czechoslovak social development.11 The proportion of towners among Slovaks is slightly higher than the national rate (27.2%). But members of some small scattered nationalities also lived in cities at a much higher rate than the country-wide: the proportion of Germans and Poles was the same in cities (43.2%). The settlement structure of the Germans was more urbanized than that of other nationalities for centuries, while in the case of the Polish migration to cities was more characteristic. The nationality living in towns in the lowest proportion were the Russians (7.3%), living in one of the most undeveloped regions of the country, and this is also reflected in their settlement structure. There are also historical reasons for the under-urbanization of the Hungarian population (14.2%).12
We get an even more detailed picture of the degree of urbanization of nationalities, their distribution according to the proportion of people living in cities and villages, if we take a look at the patterns of the distribution of nationalities according to the size groups of settlements. (See Table F4 in the Appendix)
3.3.2. Ethnic structure
In this section, we examine the ethnic structure of each nationality according to settlements. In our analysis, we analyze the ethnic structure of nationalities from two pers pectives: firstly, we examine the distribution of each nationality according to the ethnic nature of the settlements; secondly, according to the number of nationalities living in the settlements.
The Slovak nationalities are divided into 2 groups according to their ethnic structure. The first includes those that have the full spectrum of ethnic structure, i.e. all size groups include settlements where these nationalities live. Only 3 nationalities can be classified in the first category from this point of view: Slovaks, Hungarians and Russians. Group 2 includes those nationalities that have a distorted ethnic spatial structure, ie they live mostly only in sporadic settlements, incidentally living in a mino rity in some other settlements.
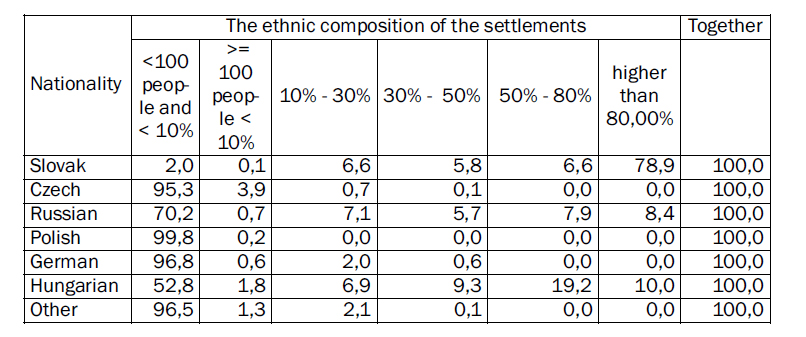
From the data in Table 4 we can see that – disregarding Slovaks – the majority of settlements were inhabited by certain nationalities whose proportion is less than 10% and their population is less than 100 people. In the case of Slovaks, the proportion of such settlements in 1950 was 2.0%. The majority of settlements inhabited by Hungarians also belonged to this group. Among other nationalities, the proportion of Russians is still the most favorable: 70.2% of the settlements inhabited by them belonged to this group of scattered settlements. More than 90% of the settlements inhabited by other nationalities fell into this category of settlements.
We can also see that a relatively small proportion of settlements falls into the other category of sporadic settlements, where the proportion of individual nationalities is less than 10%, but their population is higher than 100 people: their proportion is highest among Czechs (3.9%) and Hungarians (1.8%). Members of other nationalities live in an even smaller proportion in these settlements.
Not all registered nationalities disposed of settlements where the individual nationality was in a slight minority. Among the nationalities we examined, the proportion of Poles does not exceed 10% in any of the villages inhabited by them. The proportion of settlements where certain nationalities live in a slight minority (10%–30%) is highest among Russians (7.1%), Hungarians (6.9%) and Slovaks (6.6%).
Their proportion exceeds 1% for Germans (2.0%). Only a very small number of sett lements falls into this category (9 localities) of the localities inhabited by Czechs, as a result of which their proportion is negligible (0.7%). In 1950, 5 nationalities shared sett lements where the proportion of the studied nationalities ranged from 30% to 50%. Apart from Hungarians (9.3%), Slovaks (5.8%) and Russians (5.7%), there were 9 sett lements inhabited by Czechs and 7 inhabited by Germans exceeding 30% (0.1%, respectively 0,6%). Three nationalities belonged to the nationalities that formed a majority in settlements: besides the Slovaks, the Hungarians and the Russians. The proportion of settlements with a slight majority is 19.2% for Hungarians, 7.9% for Russians and 6.6% for settlements inhabited by Slovaks in a similar proportion.
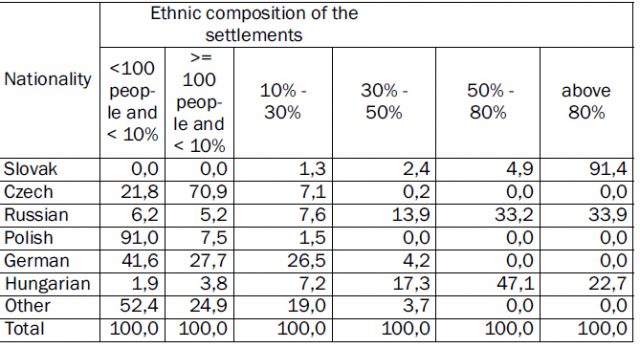
Settlements with a qualified majority included 78.9% of the settlements inhabited by Slovaks, 10.0% of the settlements inhabited by Hungarians, and 8.4% of the settlements inhabited by Russians. Now, we take a look at how the population of each natio nality is distributed according to the ethnic composition of the settlements. (Table 5) The distribution of the settlements -inhabited by nationalities and those belonging to each nationality – differs significantly according to the ethnic composition of the settlements. According to the ethnic composition of the settlements, the distribution of the Slovak population is the highest. 91.4% of them lived in places where their proportion exceeded 80%. Another 4.9% lived in settlements with a slight Slovak majority. The proportion of Slovaks in areas where they are not in the majority is negligibly low: 3.7%.
In 1950, the relative majority of Hungarians in Slovakia lived in settlements with a slight Hungarian majority (47.1%). Nearly a quarter (22.7%) of them lived in localities with a qualified Hungarian majority. At the same time, we can observe that the proportion of Hungarians is gradually decreasing in the direction of scattered settlements. Nearly a quarter of Hungarians (24.5%) lived in settlements with a Hungarian minority, 5.7% in sporadic localities.
In the case of Russians, a greater degree of scattering is observed. The proportion of people living in sporadic settlements is 11.4%, and of those living in minority settlements is 21.5%. In 1950, more than two-thirds (67.1%) of the Russian population lived in settlements where they were also in a statistical majority. Of this, the proportion of people living in qualified majority settlements was 33.9%. None the other nationalities, as already mentioned, lived in majority settlements. 7.3% of Czechs lived in minority settlements, the vast majority (92.7%) lived in diasporas. A non-negligible proportion of Germans lived in 1950 in German-minority localities (30.7%). More than 2/3 of them (69.3%) lived in diaspora. 1.5% of Poles lived in a slightly minority settlement. The vast majority of them were scattered.
The ethnic structure of the nationalities living in Slovakia is further examined according to the size groups of the number of nationalities living in the settlements. (Diagram 9) That is, we focus on how the settlements inhabited by each nationality are distributed according to the number (size groups of the number) of the nationalities living in the villages, as well as on how high the population of each nationality is in these settlements. In the first approach, the size groups of nationalities living in the settlements were considered according to the same system of categories as the one applied in Chapter 1.2.13 In this approach, in the case of Poles and Germans, we found only a very small number of settlements where their number was more than 199. Therefore, we developed a more appropriate category system for the purpose of our study. That is, the first, smallest range of the previous category system, from 0 to 199 people, was further divided into smaller units. (We created the following categories: 1; 2-4; 5-9; 10-19; 20-49; 50-99; 100-199.) The formation of the new categories follows the logic of the previous category system. As a result, the distribution of individual nationalities can be traced by groups of up to a few people in each settlement. (See Diagram 9, and also Table F5 in the Appendix)
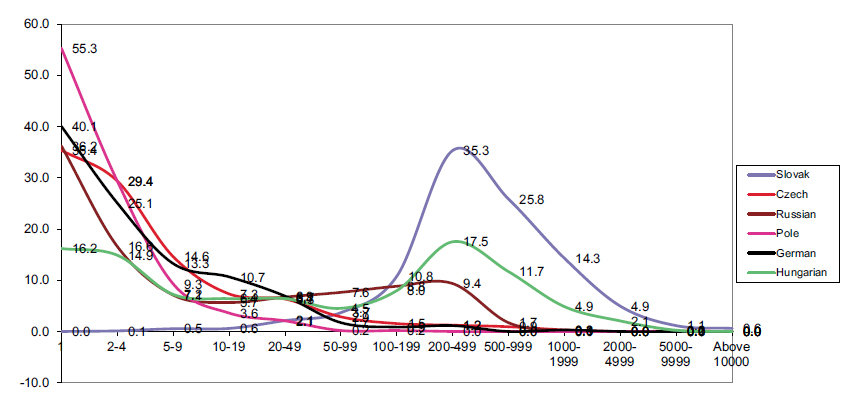
The data show that the data of the Slovak population are closest to the normal distribution. The largest proportion (35.3%) lives in communities with 200–499 and (25.8%) in settlements with 500–999 people per settlement. In the case of Hungarians, also the group of 200–499 people is the largest, but this is followed by scrap groups of 1 and 2-4 people (16.2% and 14.9% respectively), only followed by groups of 500–999 people (11.7%). In the case of other nationalities, shreds of low numbers in each sett lement are the most numerous.
Among Russians, shreds of 1 and 2-4 people are the most numerous (36.2% and 16.6% respectively), then the categories with 5–499 people occur in almost identical proportions (their proportions are between 5.7% and 9.4% respectively) In the case of scattered nationalities, it can be observed that shreds of 1 and then 2-4 people are the most common, their number decreases rapidly as moving on towards larger communities. In the case of Poles and Germans, the proportion of 1-person shreds in the settlements inhabited by these nationalities is approximately 55.3% and 40.1%, respectively, and the proportion of 2-4 people is more than ¼.
Next, we examine the distribution of the number of persons belonging to natio nalities according to their size groups in the settlements.
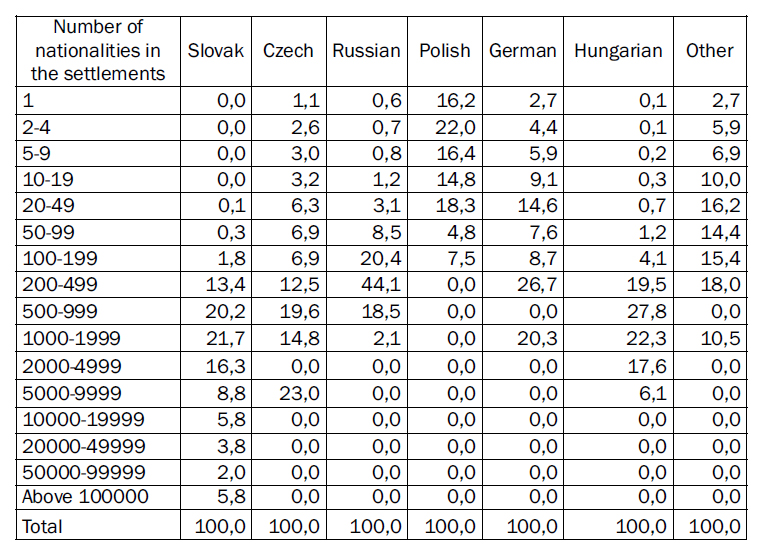
In the case of Slovaks, we can observe that in those settlements where their number does not reach 200, their proportion is very low. As the distribution of Slovaks follows national trends to a very large extent, these cases are mainly small dwarf villages. The majority of Slovaks lived in communities between 500 and 4999 (58.1%), the vast majority of which are villages, but the proportion of Slovak communities in small, medium and large settlements is also relatively proportional (5000–19999 people: 14.6%, 20,000–99,999 people: 5.8%, over 100,000 people: 5.8%).
Almost 1/4 of the Czechs (23.1%) lived in communities of less than 100 people, more than 1/3 (39.1%) in communities of 100–999 inhabitants, 14.8% in communities of 1,000 and 4,999 residents, and 23.0% (9,296 people) – equal to the population of a small town – lived in Pozsony (Bratislava) alone. 83.0% of Russians lived in settlements with numbers ranging from 100 to 9999. 14.9% lived in localities with less than 100 people, and 2.1% in places with numbers between 1,000 and 1999. In the case of Poles, the very contrary process can be observed: the largest number lived in shreds of 2-4 people (22.0%), after that their number decreases, 4.8% lived in communities of 50–99 people. Most of them lived in Pozsony (Bratislava) (135 people, 7.5%).
In the case of the Hungarian population, we can also observe that with the increase of their number is accompanied by an increase in their proportion in the loca lities. 4.1% of Hungarians live in localities numbering 100–199 Hungarians, and their number is growing rapidly in the following size groups. Most (27.8%) of them lived in communities of 500–999, their share decreased slightly in the next two size groups, and then their proportion in communities between 5000–9999 was 6.1%. The number of Hungarians exceeded 5,000 in three cities: Gúta (Kolárovo) (7748 people), Komárom (Komárno) (7077 people), Pozsony (Bratislava) (6823 people).
The proportion of Germans is also increasing almost continuously in successive size groups. The largest number lived in the groups of 200–499 (26,6%) and 1000–1999 people (20.3%).
Summary and outlook
In 1950, 20 years after the 1930 census, the first post-World War II census took place. The so called ”községsoros” (see Footnote No 4) ethnic data were not known as they were not published. The nationality data sets of the census bear the imprint of the events of the long 40 years in the evolution of the number of individual nationalities. The registered data showed the number of Hungarians and Germans significantly lower than their expected number, while that of Slovaks significantly higher. Even if they reflect the real ethnic conditions in a distorted and questionable way, the data series indicate a very large transformation of the ethnic structure: the composition of settlement patterns of demographically negatively affected nationalities has changed signi ficantly; the number and proportion of Hungarians living in cities, Hungarian-majority administrative units and settlements, Hungarian communities living in the settlements decreased, the ethnic bloc areas with significant dimensions in the 1930s became fragmented, their borders blurred, and signs of scattering appeared. The discussion of these changes, however, is a subject of further research.
Literature
Administrativní lexikon obcí republiky Československé 1955. Podle správního rozdělení 1. ledna 1955. Praha, Státní úřad statistický a ministerstvo vnitra.
Gyurgyík, László 1994. Magyar mérleg. A szlovákiai magyarság a népszámlálási és a népmozgalmi adatok tükrében. Pozsony, Kalligram.
Gyurgyík, László 2011. A szlovákiai magyar lakosság demográfiai változásai 1949 és 1963 között, különös tekintettel a népmozgalmi folyamatokra In: Hushegyi, Gábor (szerk.): Magyarok a sztálinista Csehszlovákiában 1948–1963. Pozsony/Bratislava, Hagyományok és Értékek Polgári Társulás, 26-41.
Retrospektívny lexikon obcí ČSSR 1850-1970, 1978; počet obyvatelů a domů podle obcí a částí obcí podle správního členění k 1. lednu 1972 a abecední přehled obcí a část obcí v letech 1850-1970. 2. diel: Abecedný prehľad obcí a částí obcí v rokoch 1850-1970. 2. zv., Slovenská socialistická republika. Praha, FŠÚ.
Sčítání lidu v republice Československé ze dne 1. prosince 1930. Díl I. 1934. Praha, Státní úřad statistický.
The Ethnic Composition of Slovakia’s Municipalities… 33
Sčítání lidu a soupis domů a bytů v republice Československé ke dni 1. března 1950. Nejdůležitější výsledky sčítání lidu a soupisu domů a bytů za kraje, okresy a města. Díl I. 1957. Praha, Státní úřad statistický.
Sčítanie ľudu 1950. Plocha, vek, povolanie, pomer k povolaniu, národnosť a náboženské vyznanie obyvateľstva podľa obcí. Bratislava (Nitra, Banská Bystrica, Žilina, Košice, Prešov), manuscript.
Statistický lexikon obcí republiky Československé 1955 Podle správního rozdělení 1. ledna 1955, sčítání a sčítání domů a bytů 1. března 1950. Praha, Státní úřad statistický a ministerstvo vnitra.
Tišliar, Pavol–Šprocha, Branislav 2017. Premeny vybraných charakteristík obyvateľstva Slovenska v 18.–1. pol. 20. storočia. Bratislava, Muzeológia a kultúrne dedičstvo, o. z. v spolupráci s Centrom pre historickú demografiu a populačný vývoj Slovenska Filozofickej fakulty Univerzity Komenského v Bratislave.