


 Magyar
1. Survey and sample
In June 2018, the Department of Sociological and Demographic Research of the Forum Institute of Minority Research and the National Policy Research Institute in Budapest conducted a questionnaire survey in 16 districts of southern Slovakia2 in a total of 120 settlements, as well as in Bratislava and Košice. The sample consisted of 800 adult Hungarians from Slovakia. The sample is representative in terms of gender, age group, education, type of settlement, and the share of the Hungarian population per district in the mixed-population districts of southern Slovakia.
Of the sample 47.2% were men and 52.8% were women. As for the age groups, for the sake of comparability with previous surveys, three age groups were used as the basis for sampling: aged 18–34 (27.4%), aged 35–55 (39.3%), and over the age of 55 (33.3%). Regarding education, 22% of respondents had a primary education, 28% had a high school education without a high school diploma, 34% had a high school diploma, and 16% had a higher education. Regarding the type of settlement, 38% of the respondents live in a city or a town and 62% in a village.
The primary goal of the survey was to monitor the development of national values and national identity, which we have been researching for a long time, as well as the most important background factors and their impact.
In the following, we briefly describe some of the subjective indicators of the respondents’ living conditions, quality of life, and feelings of life; then we characterize their current public attitudes. Afterwards, based on the primary results, we present the most important issues of national values, national identity, and opinions about the Hungarian existence in Slovakia, as well as language use and school choice.
The aim of this paper is to present the preliminary results so that they can be accessed and used by others as source data. Unless otherwise indicated, the results are expressed as a percentage.
2. Living conditions, quality of life, feelings of life
One of the basic factors of the quality of life is health condition. The subjective health condition of the respondents is not the health condition measured by objective me dical devices, but what they themselves perceive. In accordance with this, 75% of them consider themselves to be healthy, of which 31% have not been ill for a long time, and 44% become ill once or twice per year. Moreover, 8% of respondents are often ill but have no major problems, 11% are under constant treatment, and 5% are disability pensioners.
In our previous surveys3, we addressed health protecting and health harming determinants several times within the lifestyle issues. Due to space constraints, only a few of these indicators were included in the questionnaire this time, specifically a few questions about eating habits, sports, and smoking. Regarding eating habits, it is favorable that the majority of respondents (80%) eat regularly, i.e. either three times per day – breakfast, lunch, dinner (56%), or five times per day (24%), supplementing the three meals with 10:00AM and afternoon snacks. The majority most often consume Hungarian (84% often, 15% sometimes) and Slovak meals (37% often, 57% sometimes). The third most popular is Italian cuisine (15% often, 60% sometimes). As for the unhealthy “fast” foods (e.g., McDonald’s), 5% consume them often, 48% sometimes, and 48% never.
The most common way to spend free time is via family programs, namely active social programs, such as joint trips, cooking together, and conversations. These were mentioned by 30.4% of the respondents. This is followed by cultural activities, such as reading, watching movies, listening to music (21.4%), meeting and having fun with friends (18.5%), pursuing a favorite hobby (13%), and lastly playing sports (4.6%). Of the respondents, 12% indicated that they did not have much free time to devote to themselves.
The fact that sport is not a frequent activity is shown not only by its low share among free time activities (barely 5%), but also by the answer distributions of a separate question focused on this. When asked how often they used to do sports in their free time, the results were the following: 5% answered daily, 15% at least three times per week, 49% rarely, and 31% never. “Rarely” (i.e., fewer than three times per week) is also scarce because, according to the WHO, one needs to move for at least 30 minutes three times per week. In other words, 80% of Hungarians in Slovakia move less than is needed. However, 30% smoke (EU average is 28%), of which 15% do so conti nuously or frequently.
The impact of social relationships on the quality of life is well known. With regard to the most intimate relationships (i.e., the family), the majority of the respondents (64%) live in a permanent partnership, mostly married (54%), and the rest in a coha biting relationship (10%). Of the respondents, 23% are unmarried, almost 10% are divorced, and 4% are widowed. In addition, 71% of the respondents have children and 31% have grandchildren.
One of the manifestations of the quality of social relationships is whether there is a person we can rely on in everyday life situations. Of the respondents, 86% have such people in their lives, of which 47% answered that there are more such people, and 39% know about one such person. However, 14% of the respondents do not always perceive this social support, and there are also those (1.3%) who have no one to rely on. Here we would also mention transcendent relationships (i.e., religiosity). Almost 90% of the respondents belong to some denomination: the majority are Roman Catholic (65%), followed by 20.2% Reformed, 2.7% Lutheran, 0.6% Greek Catholic, and 0.5% of other religions. Of them 11% are non-denominational. Regardless of whether or not they used to go to church, 80.4% consider themselves to be religious, 11% non-religious, 3% a staunch atheists, and 3.3% a seekers. Among the religious, the majority are those who consider themselves religious in their own way (48%), and 32.4% consider themselves religious in accordance with the teaching of the church.
Another important indicator of the quality of life is work and everything related to it. While 69% of the respondents work, 31% have no job. According to occupational status, every second respondent is an employee: 28.7% are in the private sector and 21.9% are in the public sector. In addition, 12.7% are entrepreneurs, 7.3% students, and 3.9% unemployed; 20% are retired; 1.8% are on maternity leave; 0.6% care for a
The Primary Results of the last Hungarian Identity Survey in Slovakia 39
sick family member; and 0.4% are homemakers. Of those who have a job, the majority work as subordinates (72%). The proportion of senior managers is 9%, middle mana gers 10%, and group leaders 9%.
How do they relate to their current jobs? Almost two thirds of respondents (64.2%) are satisfied with their current job, although part of them is also excited about other areas and new opportunities (39.7%), and there are those (24.5%) who feel that they have more to offer than they do in their current job positions. An additional 27.4% claim their job is also their hobby. On the other hand, almost 9% are unable to find a job, either because they cannot find any job (4.7%), or because they cannot find a job that matches their qualification and skills (4%).
The next indicator of the quality of life is financial situation. This time, we did not search for objective indicators (income, possession of material goods, etc.) – instead we were interested in the subjective assessment of their financial situation. When asked about the financial prospects of the family, almost three quarters of the respondents (73.2%) commented positively, still considering the financial situation of the family as good (32.7%) or encouraging (40.5%). Regarding the contrasting 17.2%, there are those who still perceive it as bad (15.2%) or alarming (2%). Almost 10% could not answer the question. Excluding these, 81% rate the family’s financial outlook as positive and 19% still find it bad or alarming.
The question of what vision one wanted to realize in the next five years was used to map out plans for the future. There were eight possible answers and more than one could have been chosen. Almost one in four respondents used this option, but the majority (76%) gave only one answer, that is they mainly focus on implementing one of the following plans: 15% want to buy a car and 14% an apartment, 10% want to find a better job, 5% want to start a family, 5% want to study/acquire a profession, 5% want to start a business, and 3% want to find a job. It is noteworthy, however, that most (19%) do not focus primarily on a plan for themselves, but want to act in the public’s interest in some way.
Returning to those who chose multiple responses (different combinations of twos, threes, and fours were circled), most (13%) associated their other plans with resolving the housing situation. Summarizing the combinations of plans for the future, the three most important are resolving the housing situation (in the case of 27% of respondents, this answer was indicated as a single or primary plan), acting in the public’s interest (25%), and buying a car (23%). The following are the additional plans in order of frequency: 15% want to start a family, 13% to find a better job, 12% to study/acquire a profession, 10% to find a job, and 8% to start a business.
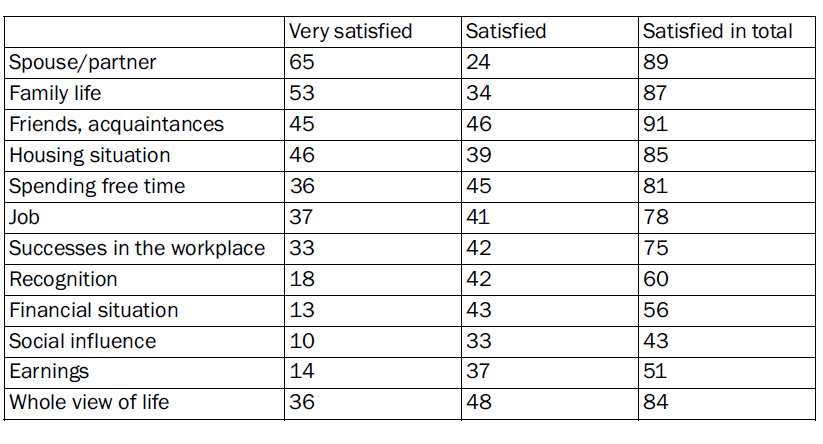
Satisfaction with different areas of life is also a reason and a consequence of the quality of life. We listed 12 areas and asked the respondents to rate them on a five-point scale indicating how satisfied they were with these areas in the previous year (i.e., in 2017). The results reveal several things (Table 1). Firstly, 84% of respondents are overall satisfied with their lives, of which 36% are very satisfied and 48% are satisfied. Furthermore, in 10 of the 12 areas assessed, the majority are satisfied (this means “very satisfied” and “satisfied”), ranging from 56 to 91%. Looking at overall satisfaction, they are most satisfied with their friends (91%), spouse/partner (89%), and family life (87%). On the other hand, if we only look at the areas they are very satisfied with, then the spouse/partner comes first (65%), followed by family life (53%), housing situation (46%), and friends, acquaintances (45%). The high level of job and housing satisfaction is in line with everything we have already learned from the answers to other questions: the majority consider their job a hobby or have at least a satisfying job, but there is a smaller group looking for a job or wanting a better job. The majority are sa tisfied with their housing situation, but there are those who regard the solution to their housing situation as their primary plan for the future.
Of the 12 areas listed, earnings are the area with which half of the respondents are satisfied (14% are very satisfied and 37% are satisfied), and the other half are dissatisfied. However, they are the least satisfied with their social influence (43% in total, of which 10% are very satisfied and 33% are satisfied). This means that, in addition to the areas already listed, the respondents are also more satisfied with their success in their workplace, the recognition they receive from others, and their financial situation and earnings than with their social influence. This is also interesting because, in gene ral, we find that people complain the most about their financial situation and earnings. In this case, however, they lack the impact on society the most.
Regarding the next important area in life (i.e., settlement), it was found that 86% of respondents do not want to change it in the next stage of their lives. Rather, they want to live where they live now, mainly because they were born there (51%) and, moreover, because they feel good there (35%). This also reflects a high level of satisfaction,
The last question relating to the quality of life was, if they looked back on their life so far, how would they see it? The responses received again support the above-mentioned results: 89% are satisfied with their lives, of which 34% are fully satisfied and 55% are satisfied for the most part. Dissatisfaction is typical for 11% of respondents, of which 10% are rather dissatisfied and 1% are very dissatisfied with their lives.
3. Public interest
Respondents’ overall interest in political and public events was measured on a five-point scale. The following results were obtained. “Medium” interest is most common (33%); otherwise there are more people who are not interested in politics (46%) than those who are interested (21%).
Nevertheless, 74% still follow the development of public events in the country, even though 31% are not interested in politics. Although the remaining 43% are inte rested in politics, 37.7% do not want to be actively involved. However, in addition to mo nitoring public life in Slovakia, 5% would like to politicize themselves.
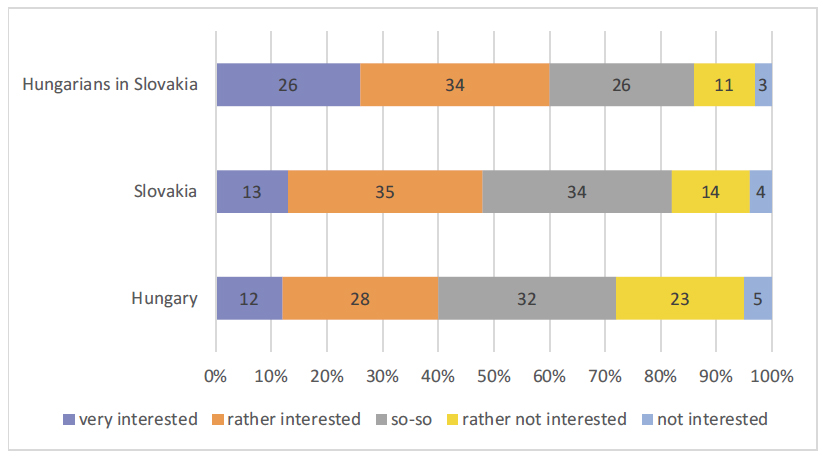
Among the specifically defined political events, such as the public issues related to the Hungarians in Slovakia, to Slovakia, and to Hungary, they are most interested in the situation of the Hungarians in Slovakia. Of the respondents, 26% are very interested in this topic, while only 13% and 12% are very interested in issues related to Slovakia and Hungary, respectively. Regarding the distribution of answers, 60% of respondents are very or fairly interested in the situation of the Hungarians in Slovakia, 48% in issues related to Slovakia, and 40% in issues related to Hungary. The lack of interest also varies: 14% of the respondents are not at all interested or rather not inte rested in the situation of the Hungarians in Slovakia, 18% in issues related to Slovakia, and 29% in issues related to Hungary (Figure 1). Respondents are most interested in the events that affect them or relate to their own situation the most, so we cannot talk about a complete lack of political interest but rather about its differentiation determined by the topic and the location.
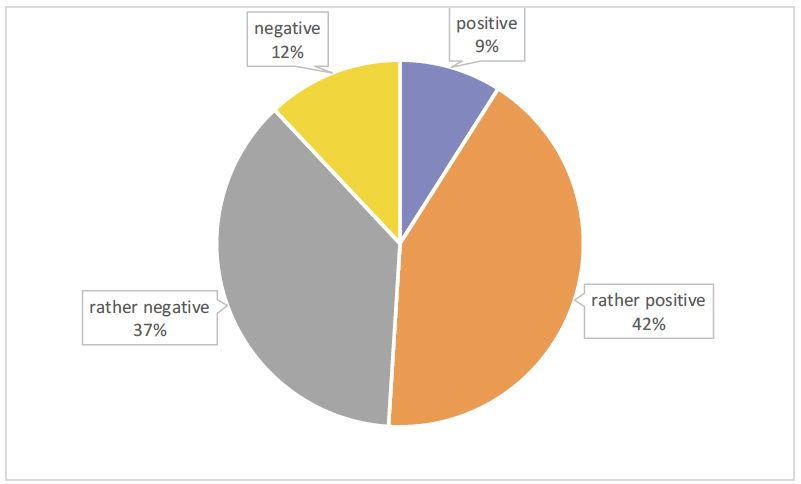
However, regarding the interest in issues related to the European Union, not only is differentiation present, but two opposing camps emerge: 51% have a positive and a rather positive opinion, 49% have a negative and a rather negative opinion. (Figure 2)
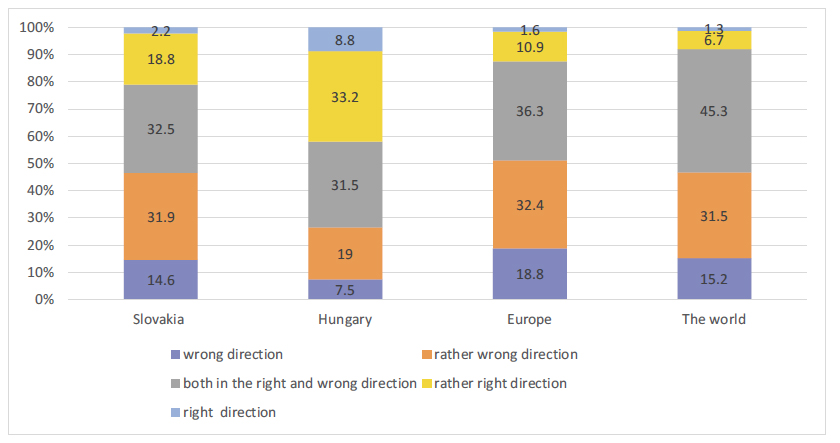
On the question of whether things were going rather in the right or rather in the wrong direction in Slovakia, Hungary, Europe, and the world, 3% could not respond referring to Slovakia, 5.6% to Europe, 8.5% to Hungary, and 10% to the world. Apart from these, considering the development of Slovakia (32.5%), Europe (36.3%) and the world (45.3%), the most common answer was that they are moving both in the right and wrong direction, whereas in the case of Hungary, it is moving rather in the right direction (33.2%). Moreover, 46.5% answered that Slovakia is definitely going in the wrong or rather wrong direction, and 51.2% think the same about Europe, 46.7% about the world, and 26.5% about Hungary. Of the respondents, 21% think that Slovakia is definitely going in the right or rather right direction, 42% agrees referring to Hungary, 12.5% to Europe, and 8% to the world. In summary, Hungary’s direction is assessed most posi tively, much more positively than the development directions of the other three cases. Following Hungary, the second most positive evaluation was given to Slovakia and afterwards to the world. Respondents are most concerned about the future of Europe. (Figure 3)
4. National self-classification
In the field of national self-classification, we examined three characteristics: (1) natio nality (i.e., declared identity, more precisely, of what nationality the respondents consider themselves to be), (2) primary self-classification (i.e., how they would mostly identify in case of a single choice), and (3) primary and secondary self-classification in case they had two choices.
4.1. Nationality – declared identity
Of the respondents, 95.6% declared themselves to be of Hungarian nationality, 3% of Slovak, 1% of Romani, and some of other nationalities (Table 2). In other words, the majority are of Hungarian nationality, which is not surprising, as the target group of the survey was Hungarians in Slovakia. However, it might be surprising that there are Slovaks, too, but this is not a new phenomenon either, as in our previous surveys, we have already faced the fact that among those considered by their environment to be Hungarians, who speak Hungarian perfectly, understand and are able to answer the questions of the Hungarian questionnaire completely, there are also those who, after all, declare themselves to be of Slovak nationality. Not only are the respondents of Hungarian nationality, but the majority of their immediate family members are too.
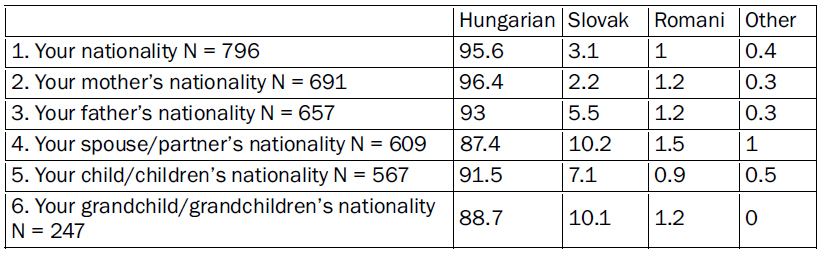
As 13.5% of respondents did not indicate the nationality of their mother and 17.5% of their father, it is not possible to reconstruct exactly the extent to which they come from a homogeneous or mixed marriage. However, it can be stated that out of the 80.4% of respondents whose parents’ nationalities are indicated, 95.3% of those who consider themselves Hungarian have both parents of Hungarian nationality (96% have a Hungarian mother and 99% have a Hungarian father), whereas 4.7% come from mixed marriages. Of the small number of respondents who consider themselves Slovaks (20 in total), 60% are children of parents from mixed marriages and 40% come from homogeneous marriages, namely from homogeneous Hungarian and homogeneous Slovak marriages in a 50/50 ratio. Thus, the respondents who consider themselves Hungarians are children predominantly of Hungarian parents, and 4.7% of Hungarian respondents are children of parents from mixed marriages. The respondents who consider themselves Slovaks are children of predominantly mixed or homogeneous Slovak parents, although 20% of them also have (or had) a Hungarian mother and father. Hence it is already true for the generation of the respondents that a mixed couple had a Hungarian child and a Hungarian couple had a Slovak child. In the sample, the latter (i.e., the fact that a Hungarian couple had a Slovak child) is almost five times more common.
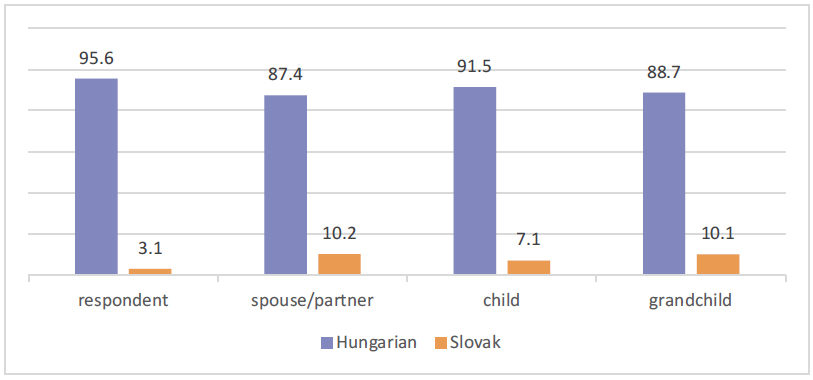
The family of the respondents is therefore largely Hungarian. At the same time, similarly to our previous surveys, the decline of Hungarians from generation to generation can be shown this time as well, since the share of Hungarian children and Hungarian grandchildren decreased compared to that of the Hungarian respondents (Figure 4).
4.2. Primary national self-classification
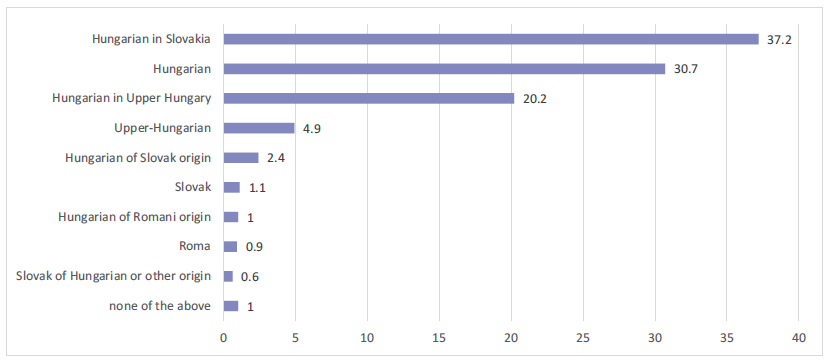
We did not ask what one’s nationality was but we listed 10 options, and from these one could choose with which they best identified. According to this, 37% mostly consider themselves Hungarians in Slovakia, almost 31% Hungarians, and 24% Hungarians in Upper Hungary4/of Upper-Hungarian origin. Moreover, 2.4% identify as Hungarians of Slovak origin, 1% as Hungarians of Romani origin, 1% as Slovaks, and 1% as Roma. In addition, 0.6% consider themselves to be Slovaks of Hungarian or other origin, and 1% of respondents do not identify with any of the above (Figure 5).
These answers also indicate that almost 96% of respondents, as in case of the declared identity, consider themselves Hungarian at the level of primary self-classification too. In particular, the vast majority of them consider themselves to be Hungarians of Hungarian origin, since they did not regard it important to indicate any other origin (Slovak, Romani, or other). The mostly Hungarian origin is also confirmed by the nationality of the parents indicated above.
4.3. Primary and secondary national self-classification
If they had not just one, but two options, who would they consider themselves to be? For this question, they could choose from 11 options. Alternatives included “a Slovak citizen” as well as “a European” and “a world citizen” (i.e., the three categories “above” national self-classification, and also the possibility of regional self-classification; from Žitný ostrov, Matúšova zem, Gemer, etc.5). Let us take a look at the results. (Figure 6)
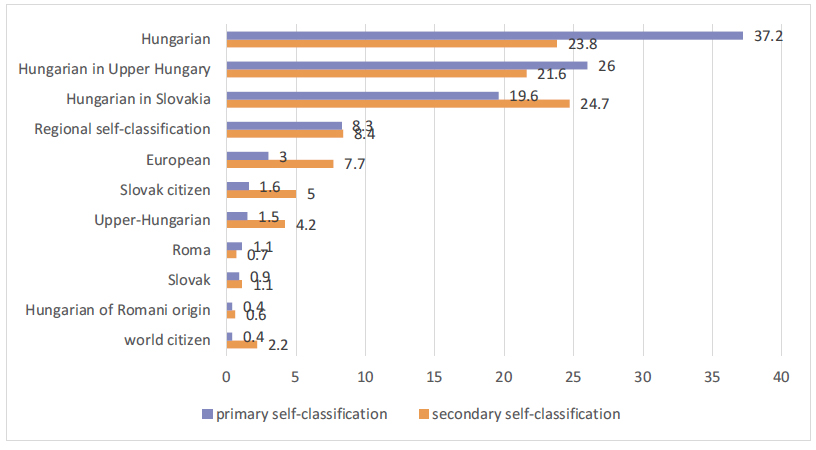
The distribution of the primary self-classification is as follows: 37% Hungarians, 28% Hungarians in Upper Hungary and of Upper-Hungarian origin, 20% Hungarians in Slovakia, 8% of regional identification, and 3% Europeans. The share of those who consider themselves to be primarily Roma, Hungarians of Romani origin, Slovak citizens, Slovaks, and world citizens ranges between 0.4 and 1.6%.
In the case of secondary self-classification, the most common answers appear almost to the same extent: 26% Hungarians in Upper Hungary/of Upper-Hungarian origin, 25% Hungarians in Slovakia, and 24% Hungarians. The extent of regional and European self-identity is almost the same. In both cases it is around 8%, although regional self-classification is slightly more characteristic of the two. Of the respondents, 5% identify themselves as Slovak citizens in matters of the secondary self-classification and 2% as world citizens. The extent for those identifying with the other options is 1% or less.
All in all, in the case when they could choose two options, most of the respondents primarily consider themselves to be Hungarians (37%), followed by Hungarians in Upper Hungary/of Upper-Hungarian origin (28%), and Hungarians in Slovakia (20%); they secondarily consider themselves to be Hungarians in Upper Hungary/of Upper-Hungarian origin (26 %), Hungarians in Slovakia (25%), and Hungarians (24%) to an almost equal extent.
Thus, the primary and secondary self-classifications show the same results as was in the case of only the primary self-classification: the vast majority of the respondents consider themselves to be Hungarians in one way or another, while identifying with different ethnonyms of the Hungarian community – mostly Hungarians, Hungarians in Upper Hungary, and Hungarians in Slovakia.
5. Opinions related to Hungarian existence and identity
One might think that the decline of Hungarians is a well-known fact in Slovakia (at least in Hungarian circles), but this is not the case. Although the majority of respondents (78.4%) are aware of this, almost 9% could not tell what the situation is like, and 13% were mistaken (i.e., they did not know either), since 9.4% claimed that the number of Hungarians in Slovakia is not changing, and according to 3.5% it increases steadily. So, although the majority are aware of the decline in numbers, almost 25% of the Hungarian respondents do not know where the Hungarian community in Slovakia is heading in terms of numbers.
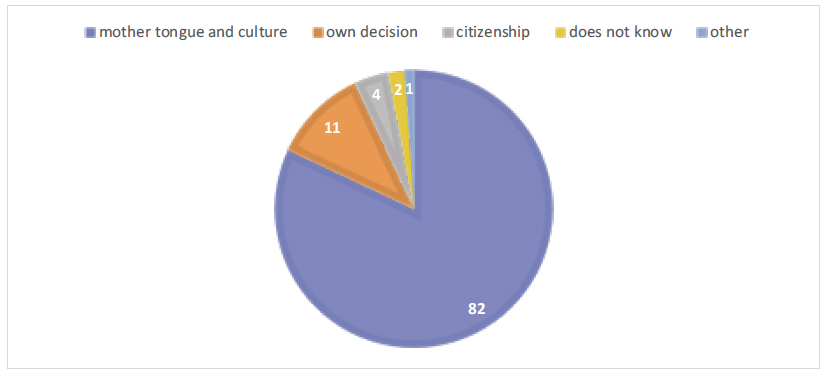
What determines the national identity of the respondent the most? Of the respondents, 82% say it is determined by mother tongue and culture (Figure 7). Almost 12% believe that national affiliation is a matter of their own decision. In other words, a person’s national affiliation is independent of mother tongue and culture, but also of citizenship. Almost 4% of them agree that a person is of the same nationality as their citi zenship.
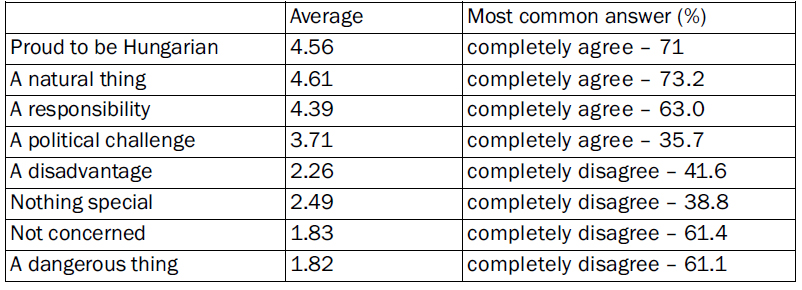
What does it mean to be Hungarian in Slovakia? Respondents rated eight statements on a five-point scale, with a score of five representing the highest degree of agreement with the statement (i.e., the higher the average, the more they agree with the statement). Of the respondents, 1–2% could not evaluate the individual statements, except “being Hungarian is a political challenge,” “being Hungarian is nothing special,” or “it is dangerous to deal with something like this,” where the ratio of “I don’t know” answers is 3–5.5%. The omission of these answers reveals the following picture (Table 3). If we take as a basis only the proportion of those who completely agree, it also shows that the respondents agree the most with the statement that being Hungarian is natural for them because Hungarian is their mother tongue and they grew up in Hungarian culture (73.2%). Simultaneously 71% are completely proud to be Hungarian, and 63% fully experience their Hungarianness as a responsibility in the sense that they know that Hungarian culture must be preserved in order to survive. Compared to the previous ones, there is much less agreement (35.7%) with the statement that Hungarianness is a political challenge because it is important to live as an organized community. However, this average (3.71) testifies that “being Hungarian = responsibi lity” is evaluated also in a more positive manner, as it falls in the “rather agree” range. The majority do not agree with the statements that nationality is a disadvantage, it does not mean anything special, it does not concern the respondent, or it is dangerous to deal with the issue of nationality.
Detailed response distributions are shown in Figure 8. It is also clear from these answers that the majority are proud of their Hungarianness, believe that being Hungarian is natural, feel responsible for it, and perceive it as a political challenge, even though there is a small proportion of respondents that is more neutral or dismissive. Just as there are those who agree that it is a disadvantage for them to be Hungarian in Slovakia because as a minority it is more difficult for them to prove successful and/or they are not preoccupied with their nationality, moreover they think that it is dangerous to deal with such things. In other words, although the attitude towards the above-mentioned indicators of Hungarian existence is largely positive, there is a kind of divergence.
All this is in line with our previous results6, according to which three national value systems of the Hungarians in Slovakia can be detected: the resolute, the receding, and the rejecting national value systems.
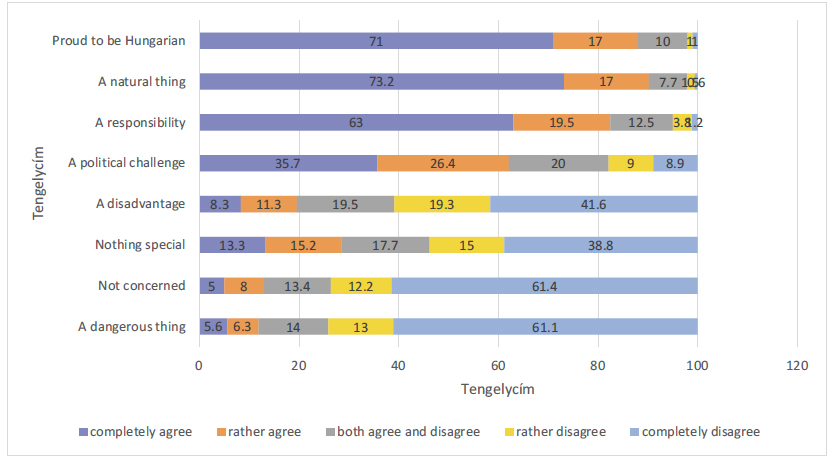
Figure 8 shows that 61% of the respondents reject the statement that being Hungarian hinders their success in Slovakia, almost 20% both agree and disagree with it, and almost 20% also accept it. In other words, according to every fifth respondent, being Hungarian is more of a disadvantage because that is the reason for why they cannot prove to be successful. In this regard, there was another question in the questionnaire: “In your opinion, is it an obstacle to prove successful in Slovakia if one is Hungarian?” The answers show that 73% say that being Hungarian does not hinder their success. Moreover, 4.5% of them believe that not only is it not a disadvantage, but it is a direct advantage. However, those respondents (21.5%) who think that being Hungarian is a disadvantage also reappear. According to half of such respondents, Hungarianness is an obstacle in all fields, and according to the other half, it is only an obstacle in certain specific fields. Like in our previous surveys, by the specific field most people understand that it is more difficult to enter into public administration, or more precisely into any sphere where you need to know Slovak well, as a Hungarian. Thus, the disadvantages mentioned by them are not really related to Hungarianness, but to the inadequate knowledge of the Slovak language (which, in turn, is associated with the Hungarian-language schools where, in their opinion, it is not possible to learn Slovak). In this respect, there are significant differences on the basis of education: the more uneducated the respondents are, the more they consider Hungarianness to be an obstacle to their success, and the more educated they are, the less they consider Hungarianness to be an obstacle to their success. In fact, they even regard it as an advantage.
After what has been said, the question almost arises as to whether or not Hungarianness should be taken on, and if so, in what situation. The majority of the respondents (81.8%) consider it necessary to take on Hungarianness, while 16.8% answered that they do not usually deal with this issue, and 1.6% say that they do not know in what situation it should be taken on. Those who think that it should be taken on are divided into two groups. One group (54%) considers it necessary to take on Hungarianness in all situations, even if there is a disadvantage. The other one (27.5%) makes the commitment of Hungarianness conditional: 19.5% claim it should be taken on when one does not feel threatened, 7% when it suits the person, and 1% when there is an advantage from it.
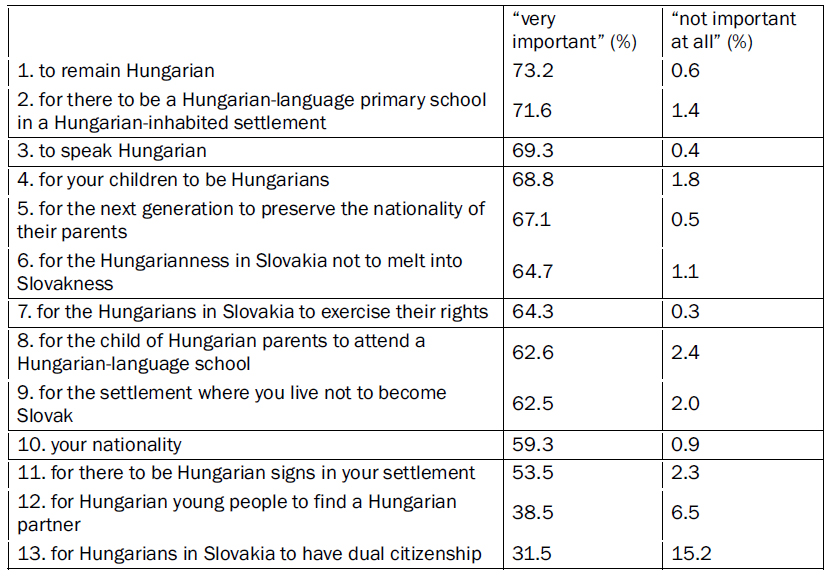
Our previous surveys also support the fact that the acceptance of Hungarianness in practice is influenced by how important the factors related to the value dimension of national identity are for those concerned. The more important it is for someone to be Hungarian, for their descendants to remain Hungarians, for them to speak Hungarian, for their child to attend Hungarian-language primary school, and so on (we listed 13 factors in the questionnaire), the more likely it is for them to make decisions that strengthen the Hungarian identity in the decision dimension of national identity. The reverse is also true: the less important, that is, of less value it is to them, the more likely the decisions that generate assimilation are. The importance of the 13 factors to the respondents was measured on a five-point scale, with a score of five representing maximum importance. Table 4 shows the averages of the evaluations of each factor. From these, we can conclude that the assessment of all factors falls between the “very important” and “fairly important” range, with the exception of two: Hungarian young people should find a Hungarian partner and Hungarians in Slovakia should have dual citizenship (the latter mostly falls in the “both important and not important” range).
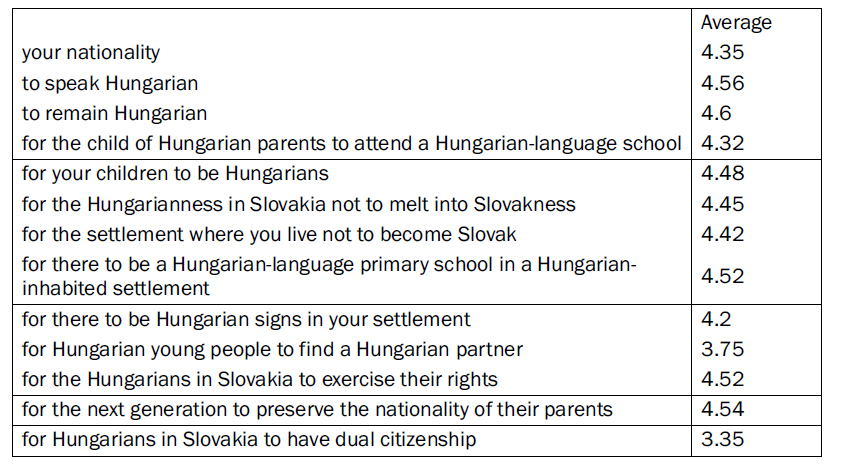
Table 5 shows the factors in descending order of importance and presents the “very important” and “not important at all” response distributions representing the two endpoints of the scale. According to these, the respondents consider it most important to preserve their Hungarianness (very important for 73.2%) and for there to be Hungarian-language primary schools (very important for 71.6%). This time, too, the least important thing is for Hungarian young people to find a Hungarian partner and for Hungarians in Slovakia to have dual citizenship – these two are also the most unimportant factors for them. These results are consistent with the results of our assimilation research conducted on a sample of 3,000 in 2014, where these were the two most important and two least important factors too.
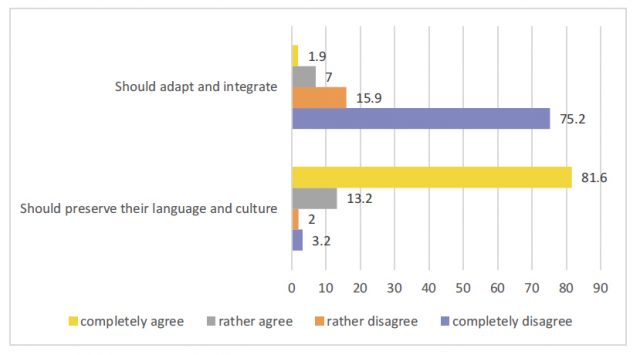
Thus, almost three quarters of the respondents consider it very important that he or she remains Hungarian as an individual. However, what about the community of Hungarians in Slovakia? Should the Hungarians survive or melt into the Slovak nation? (Figure 9) The majority (81.6%) vote for survival, as they completely agree that Hungarians should preserve their language and culture. Three out of four respondents completely reject the Hungarians’ adaptation and integration into the Slovak nation.
They share a similar view on whether the representatives of national minorities should strive to preserve national identity. Almost all of the respondents (95%) answered that they should. The majority of them (86.7%) also claim that the state should support national minorities in preserving their identity, while a further 8.2% of those who agree assert that efforts should be made to preserve national identity but without the support of the state. In addition to those who consider the preservation of national identity important, there is a group amounting to 5% who state that efforts to preserve national minorities are unnecessary or downright inappropriate.
Moreover, on whom does the survival of Hungarianness in Slovakia depend the most? According to 92.3% it depends on the Hungarians themselves: according to 66.2% of them generally on Hungarians, according to 15.6% on Hungarian parents, and according to 10.5% on Hungarian young people. The Slovak state can contribute 4.5% and the Hungarian state 1.2% to the survival of the Hungarians, the Party of the Hungarian Community7 1.7%, and Most-Híd8 0.3%. This means that the individual primarily guarantees survival.
At the same time, we received much more restrained answers to the question of how the respondents themselves would contribute to the survival of Hungarians in Slovakia. Only fewer than half of the respondents (42.7%) believe that they can contribute to the survival of the Hungarians with something particular. The majority claim either that they cannot contribute (28.5%) or that they do not know how to contribute (29%).
6. Language use and school choice
In the previous chapter, we talked about how important the respondents consider the values of preserving the Hungarian identity, including the use of mother tongue and the preference of a Hungarian-language primary school for Hungarian children. As a reminder, 69% consider it very important to speak Hungarian and 54% to have Hungarian signs in their settlement. At the same time, almost 72% think that it is very important to have Hungarian-language primary schools in Hungarian-inhabited settlements. In the following, we take a look at how these preferences are reflected in practical life. In other words, we examine how characteristic it is of the respondents to use the Hungarian language and to have their children enrolled in a Hungarian-language primary school.
6.1. Family and public language use
Regarding the family language, in their childhood the respondents predominantly used Hungarian: in the case of 92% the parents spoke Hungarian with the respondents, and in the case of 5% the parents preferred Hungarian. In addition, 2% mentioned that Hungarian was spoken at home as often as Slovak, and 1% said that they spoke Slovak or preferred Slovak. These data support not only the Hungarian nationality, but also the Hungarian origin of the majority of the respondents. Simultaneously, we can conclude from them that the majority of the 20% of the respondents who did not indicate the nationality of one or both parents are probably also the children of a homogeneous Hungarian couple or at least of parents from a mixed marriage who use the Hungarian language exclusively or predominantly.
Before characterizing the current language use, it is necessary to determine the ethnic structure of the wider environment of the respondents, as this influences both family and public language use (Figure 10). By wider we mean the wider family, colleagues, friends, neighbors, bosses, and business partners. These are the people with whom they are likely to come into contact most often, as well as the most influential and popular people in their settlement who have a certain degree of influence regarding formal and informal opinions.
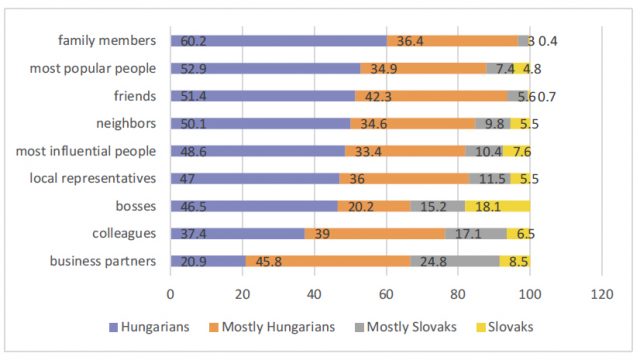
Most of these people in the respondents’ environment are Hungarians or mostly Hungarians. The environment consisting only of Hungarians is most characteristic of the wider family (the nationality of the wider family members is Hungarian in the case of 60%); it is the least characteristic of business partners, 21% of whom are Hungarian. Roughly half of the most popular people, friends, and neighbors in their settlement are Hungarian. The proportion of Hungarians among the most influential people, local representatives, managers, colleagues, and business partners falls below 50%, but in all cases it is mostly a Hungarian environment. The mostly Slovak or Slovak environment is largely characteristic of the workplace and the general area of work, mainly of the business partners, since one in four of them is mostly Slovak and 8.5% of them are Slovak. A third of the bosses are also mostly Slovak and the same is also true for almost a quarter of colleagues. Here we would like to note that the attitude of the respondents towards Slovaks is largely positive: 28.6% claim it is very good and 38% say it is good, whereas only 7.2% consider their relationship with Slovaks to be rather bad or bad.
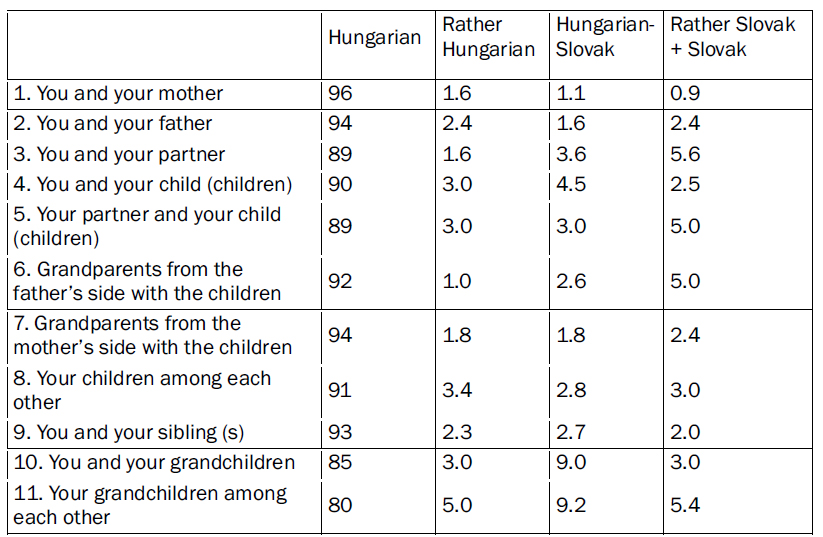
The current family and public language use of the respondents therefore takes place in the ethnic/linguistic environment outlined above. The data show that the domi nant language of the family is currently Hungarian (Table 13), as some family members primarily use Hungarian in mutual communication. This is most characteristic of the mutual communication of the respondent and their parents (96 and 94%, respectively), the respondent and their siblings (93%), and the grandparents (i.e., the parents of the respondents) and their grandchildren (i.e., the children of the respondents; 92 and 94%, respectively). Regarding the youngest generation, in the communication between the respondent and their grandchildren (85%) and in the mutual communication between the respondent’s grandchildren (80%), the use of Hungarian is less frequent than in previous generations, but in these cases the most frequently spoken language is Hungarian.
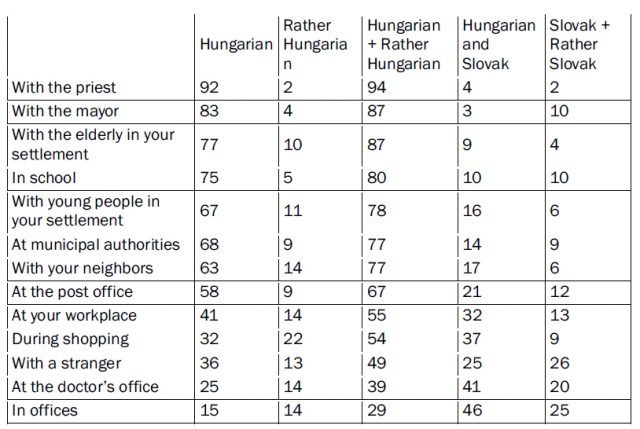
In the survey of public language use, we focused on 13 areas that we considered most important and previously researched (Table 14). Three of them are characterized by mixed (Hungarian-Slovak) or rather Slovak language use. These three areas are: dealing with official matters (81% mixed or rather Slovak communication), doctor visits (61%), and addressing strangers (52%). The other areas are characterized by communication in mostly Hungarian (only Hungarian or rather Hungarian), although not to the same extent. The extent of use of only Hungarian or rather Hungarian is between 54% and 94%. The upper limit is communication with priests, with whom 94% of respondents speak mostly Hungarian (of which 92% speak only Hungarian and 2% rather prefer Hungarian). The lower limit is shopping, when 54% speak mostly Hungarian (of which 32% speak only Hungarian and 22% rather prefer Hungarian). The mayor is the second most common person, with whom they speak mostly Hungarian (87%), but in municipal authorities this proportion drops to 77%. The third area of the mostly Hungarian language use is in school, where three quarters of the respondents indicated only Hungarian, and 5% indicated rather Hungarian. Table 14 shows the 13 communication areas in descending order of the extent of Hungarian language use.
In further questions on language use, we discussed how tolerant the respondents are of non-Hungarian language use. The data show a high degree of tolerance. The majority of respondents are not bothered at all when someone in the family speaks another language (81%), just as they are not bothered by someone from the mixed population in southern Slovakia who speaks another language in public (94%). In addition, 62% absolutely tolerate when Hungarians in Slovakia mix Slovak words into their speech, and 56% tolerate it when they mix English words into their speech.
Regarding the use of visual language on public signs in southern Slovakia, 83% of the respondents are not bothered at all by Slovak signs and 74% are not bothered by English signs (e.g., “showroom” or “shop”).
The presence of bilingual Slovak-Hungarian signs in public places in southern Slovakia is considered to be very important by every second respondent, and 26% regard them as important. For every fourth respondent, this is rather not important or not important at all.
6.2. School choice
As we know, almost 96% of respondents are of Hungarian nationality. However, only 90% completed a Hungarian-language primary school, while 91% of their fathers and 94% of their mothers attended a Hungarian-language primary school.
Of the respondents who completed the following types of school and of those who completed them in Hungarian language, 55% graduated from vocational training school, 65% from vocational secondary school, 88% from grammar school, and 38% from college/university. Moreover, 48% received post-secondary vocational training in Hungarian (including a bachelor’s degree for undergraduate studies) and 20% received tertiary higher education or its equivalent (PhD, MPH) in Hungarian.
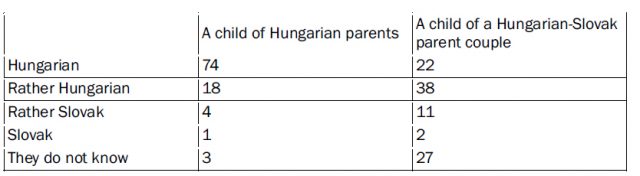
After these facts, let us take a look at how they contemplate school choice (Table 15). First of all, what kind of primary school should a child of a Hungarian and a mixed couple attend? Although 90% of respondents have finished a Hungarian-language primary school, only 74% resolutely state that a child of Hungarian parents should attend a Hungarian-language primary school. Few people agree with their child attending a Slovak-language primary school; however, 22% of the respondents are somewhat uncertain and indecisive about the issue, even if they are more inclined towards a Hungarian-language primary school. In the case of a child of a Hungarian-Slovak parent couple, 27% could not express an opinion, whereas those who could preferred a Hungarian-language school in their answers.
Afterwards we asked whether they agreed or disagreed that a Hungarian child should attend a Hungarian-language primary school. The results show that 92% agree, mostly because they consider it important for the child to learn in their mother tongue (53%). The second most important reason was that it is easier to learn in one’s mother tongue (22%). In addition, 9% claim that the child should attend a Hungarian-language primary school because they will be more connected with Hungarian culture, 5% state that they will preserve their roots thanks to a Hungarian-language primary school, and 3% say that a Hungarian child should attend a Hungarian-language primary school because they will learn neither Slovak nor Hungarian correctly in a Slovak-language primary school.
However, 8% of respondents think that it is not good for a Hungarian child to go to a Hungarian-language primary school because they will not learn Slovak (5%) or it will be more difficult for them to prove successful (3%).
In these cases, we considered opinions. Now let us take a look at what the reality is (i.e., regarding the language of instruction), in what kind of school the respondents with children of this age enrolled their children (Table 16).
A child of Hungarian parents A child of a Hungarian-Slovak parent couple Hungarian 74 22 Rather Hungarian 18 38 Rather Slovak 4 11 Slovak 1 2 They do not know 3 27
The Primary Results of the last Hungarian Identity Survey in Slovakia 59
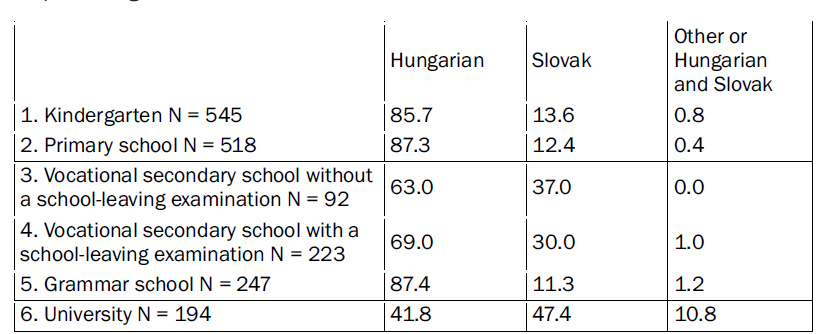
Much can be interpreted from the data, but at this time we will focus on just a few aspects, primarily the choice of kindergarten and primary school. Firstly, it can be observed that the majority of parents contemplate either a Hungarian or a Slovak kindergarten/primary school. There is a negligible number of parents who would alternate these educational institutions in the sense that they enroll their child first in Hungarian and then in Slovak institution (or vice versa), and also in the sense that, in the case of several children, one would be enrolled in a Hungarian kindergarten/school and the other in a Slovak one. Secondly, 85.7% of the respondents send or sent their child to a Hungarian kindergarten and 87.3% to a Hungarian primary school, which corresponds with the majority. However, if we compare these proportions with the Hungarian-language school attendance of the responding parents and their parents, we can observe the seemingly small “generation gap” of at least 3%, which is just enough to contribute to the weakening of the national identity of Hungarians in Slovakia due to preferring a Slovak-language primary school when choosing a school and consequently also to the continuous decline in their numbers.
From the free answers/explanations following the closed questions, it became clear again that several factors play a role in the choice of a Slovak-language primary school. It is mainly the case when at least one of the Hungarian parents attended a Slovak-language primary school or one of the parents is of Slovak nationality (i.e., they are a mixed couple). However, these correlations do not change the essence of the matters – they even re-support what we have revealed in our previous surveys: in addition to origin, school choice, and language use, choice of partner is the fourth key factor of national identity. Furthermore, the geographical distance of a Hungarian-language school is only one of the many reasons for choosing a Slovak-language primary school.
Translation by Beáta Izsófová